


FXOpen

Alternative crypto-currencies are back under pressure after a resurgence in bitcoin prices. Earlier today BTC/USD took out the all-time high again and peaked at $8,025 dollars per coin. This put alts back under pressure.
ETH/BTC Back in Range
Ether is back in a range versus bitcoin. This week’s push above 0.05 BTC ended the downtrend. But the gains stopped not far from here without breaking the important 0.05545 swing high. Thus no rally was triggered.
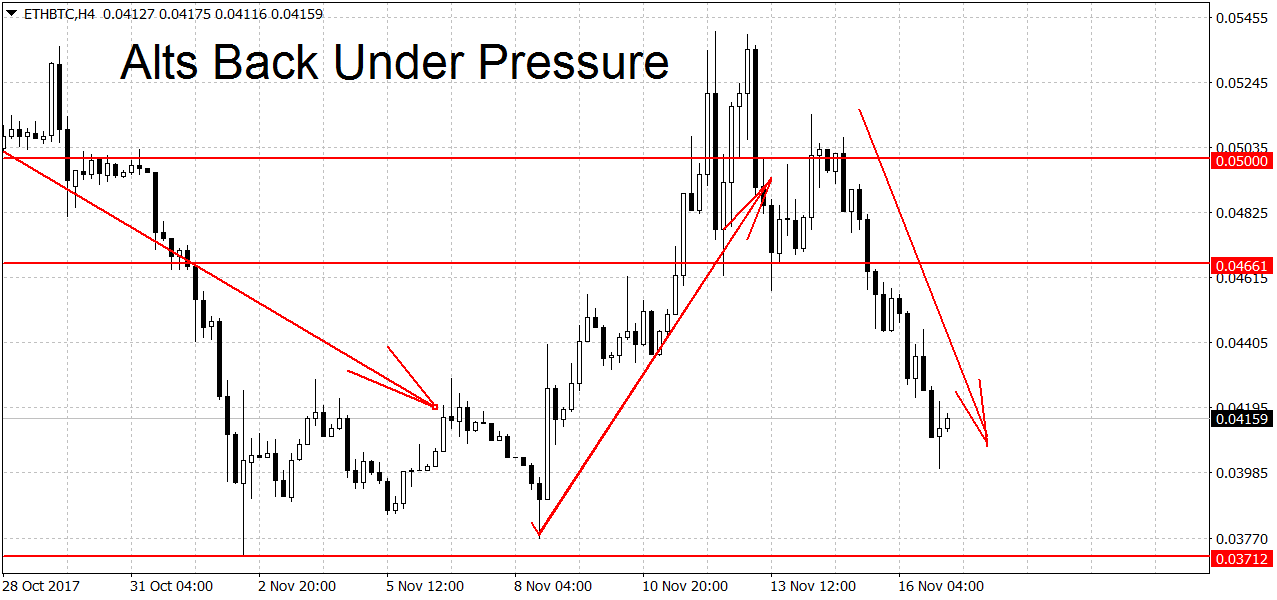
As you can see on the chart above the segwit2x relief rally was being sold into. But the bears need a break below last week’s low at 0.03712 for a new downtrend. The other trend-starting level is 0.05545 BTC on the upside. A breakout above here could start a rally. Slightly below here we have two weaker resistance levels at the 0.05 round figure followed by this week’s top at 0.0541 BTC per coin. On the longer-term charts, the picture is mixed, downtrend on the weekly but bullish on the monthlies.
Strong Rally in Dash
Bucking the trend of most altcoins, DSH/BTC is in rally mode. Prices broke above the important 0.055 level on Monday, thereby triggering a new bull market on the dailies. The coin then proceeded to peak out at 0.08572 BTC before being sold as BTC/USD rallied.
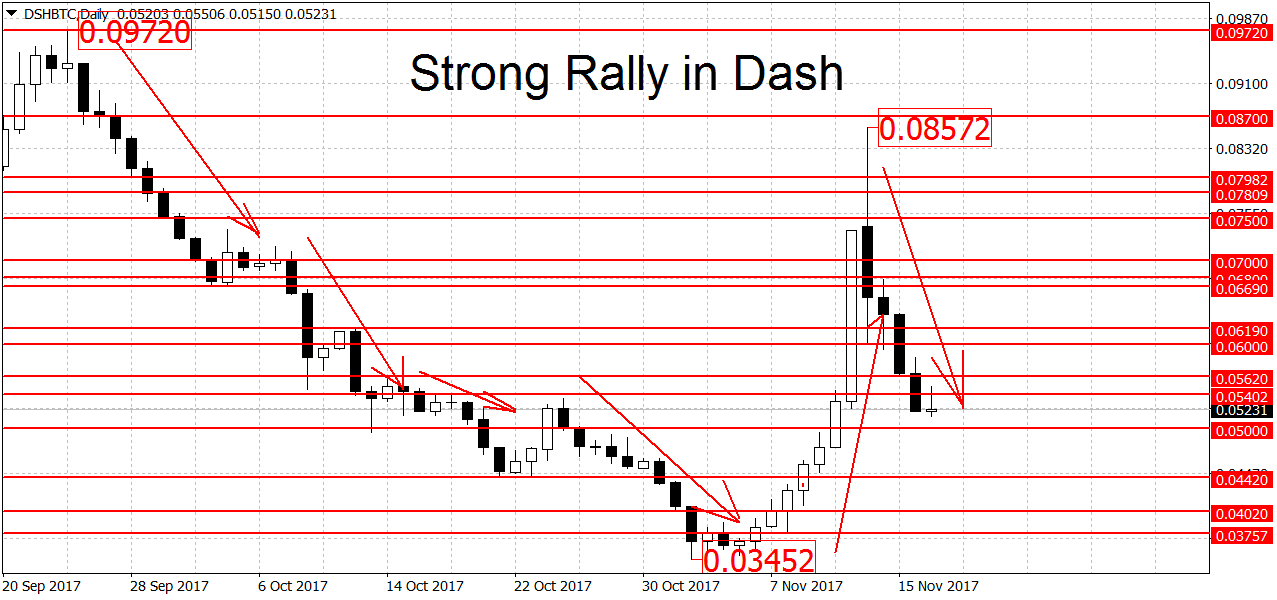
We are currently quoted at 0.05231, slightly below the 0.055 breakout level. Support can be found at the 0.05 round level, followed by a support area in the 0.04 to 0.044 range. But to end the current uptrend the bears will have to push us below 0.03757 BTC. A new downtrend requires a break below the multi-month lows at 0.03452 BTC. No change on the long-term charts. Here the trend is up on the monthly but down on the weekly.
New All-time High for Bitcoin
Earlier today BTC/USD broke its previous high at $7,887 and made a new all-time high at $8,025 dollars per coin. Bitcoin is now back in an uptrend and a move below the $5,426 swing low is needed to end it.
Note that volatility for BTC/USD is very high right now. We fell $2,461 dollars in five days, only to rally $2,599 dollars in the next five. Because of this, it would be prudent to keep your trading sizes much smaller than usual. Bitcoin is bullish on both the weekly and the monthly charts.
If you would like to start crypto trading but afraid of risks, try cryptocurrency demo trading.
FXOpen offers the world's most popular cryptocurrency CFDs*, including Bitcoin and Ethereum. Floating spreads, 1:2 leverage — at your service. Open your trading account now or learn more about crypto CFD trading with FXOpen.
*At FXOpen UK and FXOpen AU, Cryptocurrency CFDs are only available for trading by those clients categorised as Professional clients under FCA Rules and Professional clients under ASIC Rules respectively. They are not available for trading by Retail clients.
This article represents the opinion of the Companies operating under the FXOpen brand only. It is not to be construed as an offer, solicitation, or recommendation with respect to products and services provided by the Companies operating under the FXOpen brand, nor is it to be considered financial advice.
Latest articles

Google Share Price Rose Post-market to a New All-time Record
Yesterday, after the close of the main trading session, a report on activities for the 1st quarter of Alphabet Inc. (Google's parent company) was published. The report was strong, exceeding investors' expectations.
→ Quarterly EPS = USD 1.89 (expected = USD 1.

S&P 500 Rebounds after Negative GDP News
Data released yesterday showed US GDP growth slowed to 1.6% in the first quarter of the year. According to ForexFactory: forecast = 2.2%, past value = 2.4%.
Reaction to the news sent the S&P 500 mini stock

GBP/USD And USD/CAD Daily Chart Outlook
GBP/USD is attempting a recovery wave from 1.2300. USD/CAD is consolidating and might aim for a move above the 1.3760 resistance zone.
Important Takeaways for GBP/USD and USD/CAD Analysis Today
· The British Pound started