


FXOpen

AUD/USD is gaining bullish momentum and it recently broke the 0.6800 resistance area. NZD/USD is also showing a lot of positive signs and it recently settled above the 0.6350 hurdle.
Important Takeaways for AUD/USD and NZD/USD
- The Aussie Dollar is trading in a bullish zone above the 0.6800 and 0.6810 supports against the US Dollar.
- There was a break above a major bearish trend line with resistance near 0.6760 on the hourly chart of AUD/USD.
- NZD/USD is also gaining momentum above the key 0.6350 resistance area.
- There was a break above a key bearish trend line with resistance near 0.6295 on the hourly chart.
AUD/USD Technical Analysis
This week, the Aussie Dollar formed a major support near the 0.6740 area and started a fresh increase against the US Dollar. The AUD/USD pair broke many key resistances near 0.6750 and 0.6760 to move into a positive zone.
There was a close above the key 0.6800 resistance area and the 50 hourly simple moving average. Moreover, there was a break above a major bearish trend line with resistance near 0.6760 on the hourly chart of AUD/USD.
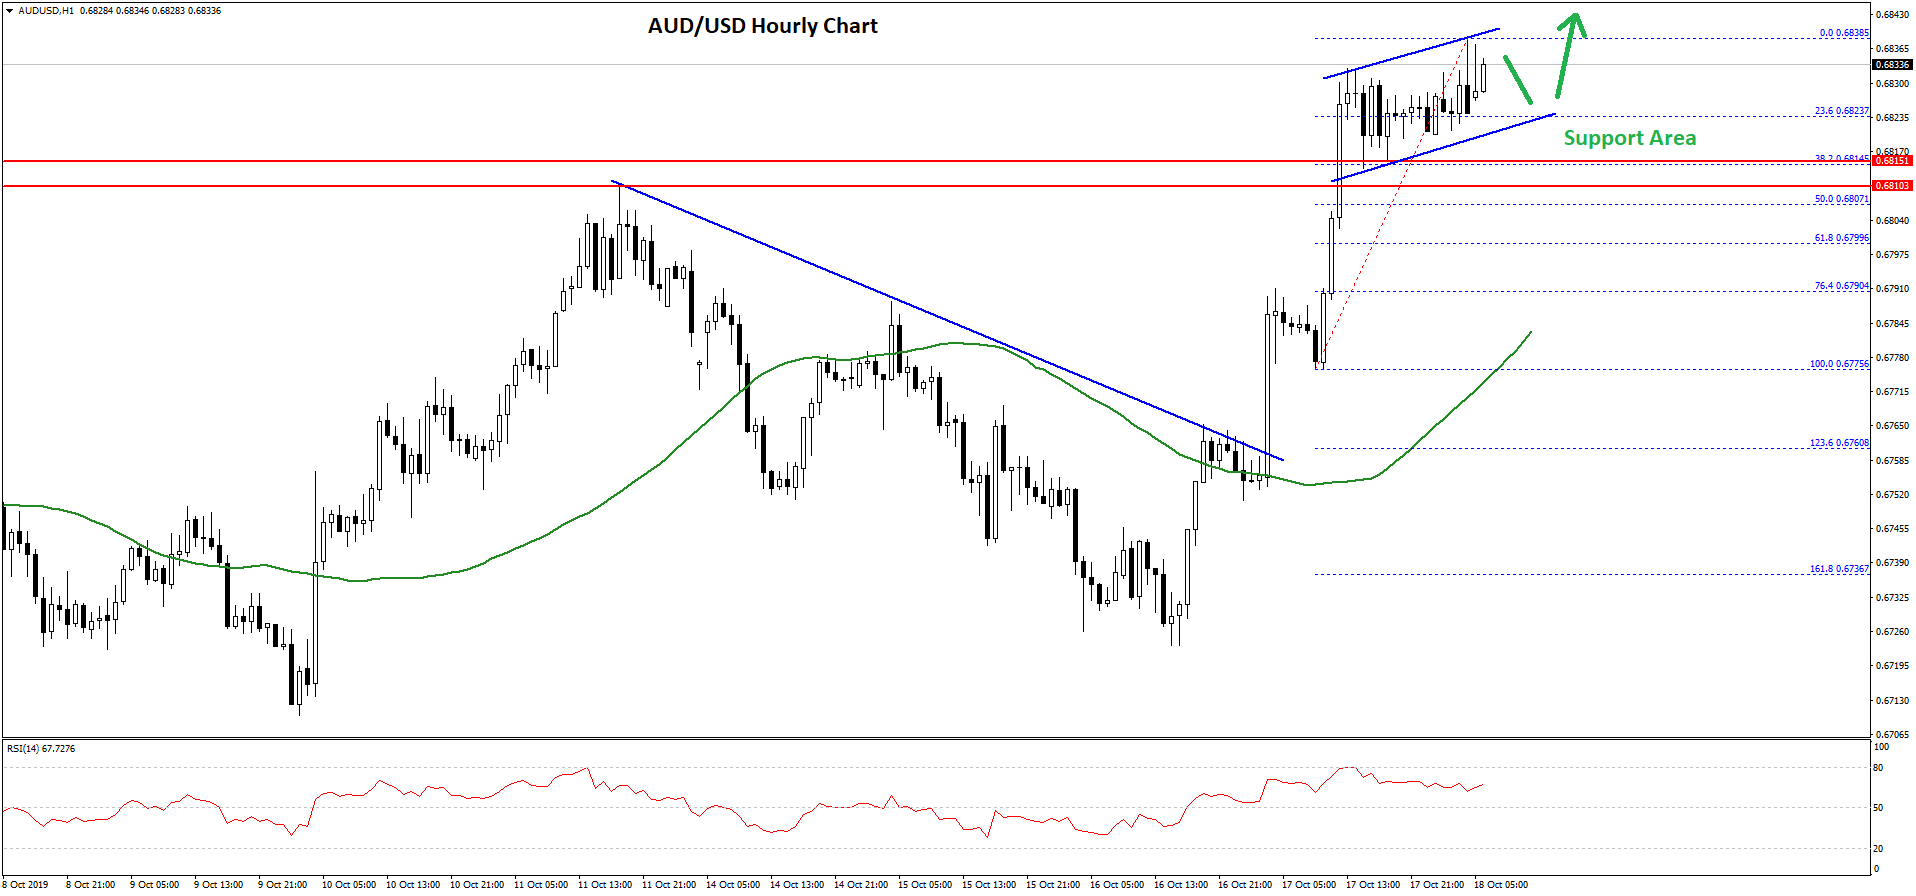
The pair even broke the 0.6820 resistance, traded to a new high near 0.6838 on FXOpen, it is currently consolidating losses. An immediate support is near the 0.6820 level.
Moreover, the 23.6% Fib retracement level of the recent wave from the 0.6775 low to 0.6838 high is also near the 0.6820 level. There is also a rising channel forming with support near the 0.6820 level on the hourly chart.
If there is a downside break below 0.6820, the pair could correct lower towards the 0.6800 support area. An intermediate support is near 0.6808, plus the 50% Fib retracement level of the recent wave from the 0.6775 low to 0.6838 high.
Only a close below the 0.6800 support might start a major correction towards the 0.6760 support area in the near term. On the upside, a clear break above the 0.6840 resistance may perhaps call for more gains towards the 0.6880 level.
NZD/USD Technical Analysis
The New Zealand Dollar also followed a similar pattern from the 0.6280 support area against the US Dollar. The NZD/USD pair broke the key 0.6300 resistance area to move into a positive zone.
During the rise, there was a break above a key bearish trend line with resistance near 0.6295 on the hourly chart. The pair even settled above the 0.6320 resistance and the 50 hourly simple moving average.
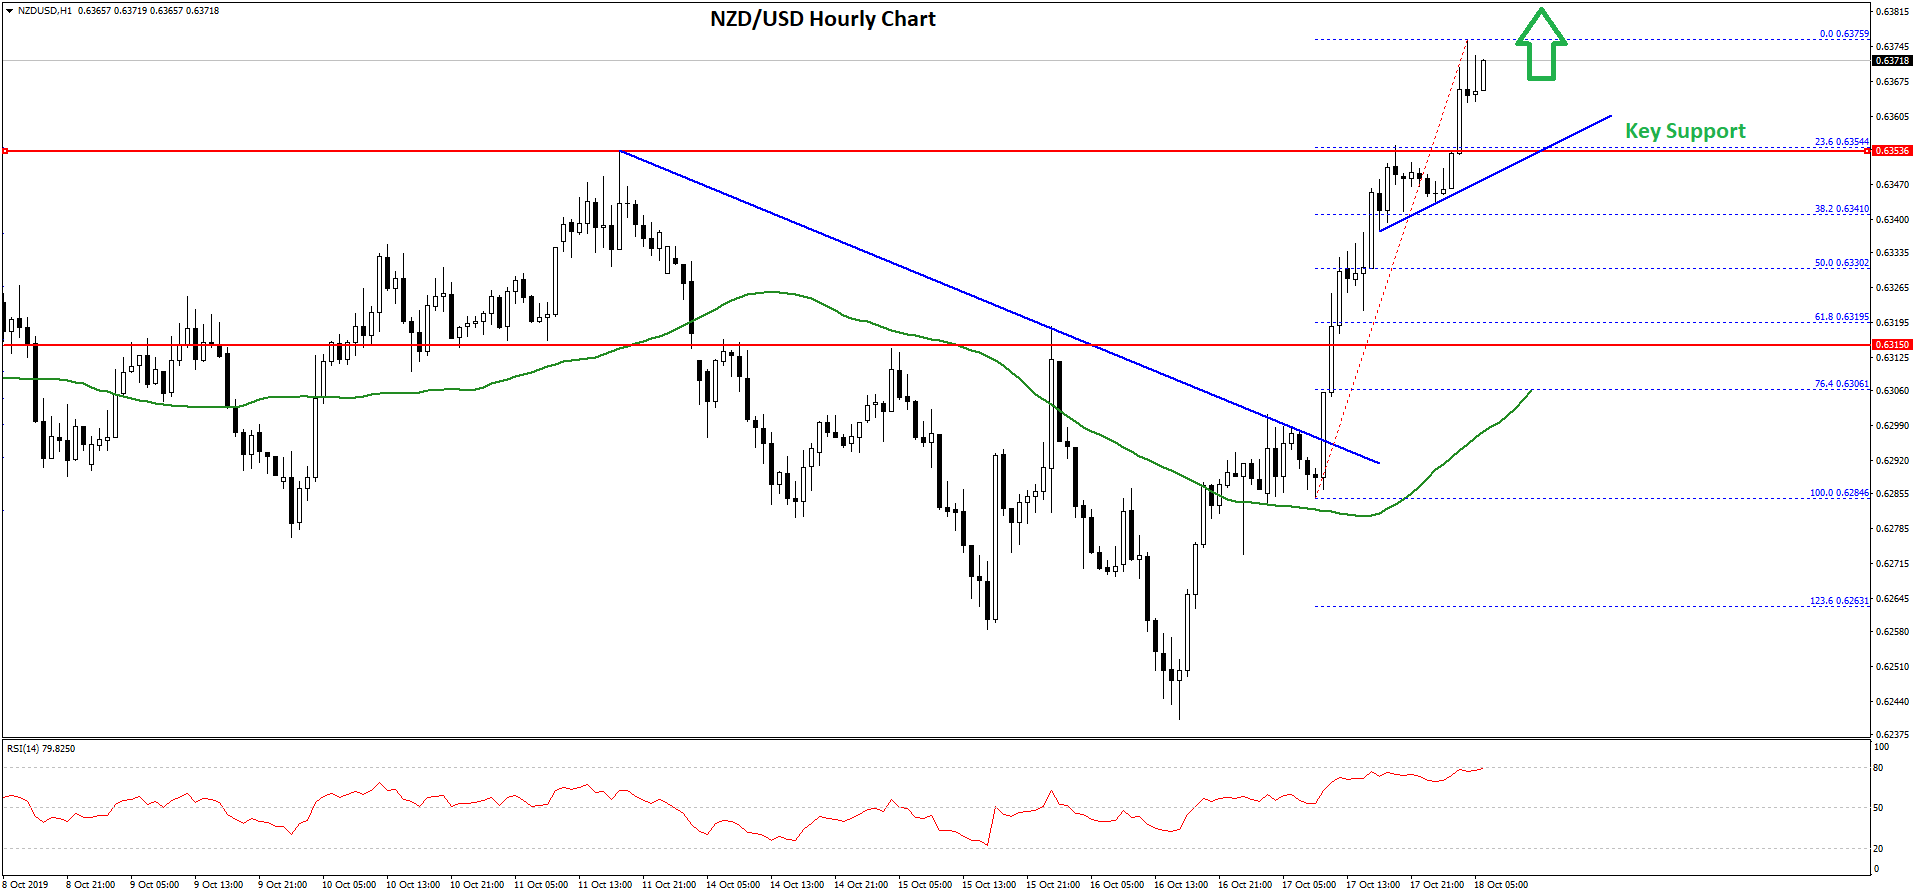
Finally, there was a break above the 0.6350 resistance and the pair traded to a new high near the 0.6375. The pair is currently elevated, with an immediate support near the 0.6355 level.
Moreover, the 23.6% Fib retracement level of the recent wave from the 0.6284 low to 0.6375 high is near the 0.6354 to provide support. There is also a connecting bullish trend line forming with support near 0.6355 on the hourly chart.
Therefore, the pair remains well supported above the 0.6350 level. The next key support is near the 0.6330 level, which coincides with the 50% Fib retracement level of the recent wave from the 0.6284 low to 0.6375 high.
On the upside, a clear break above 0.6375 could push NZD/USD towards the 0.6400 level in the coming sessions.
Trade over 50 forex markets 24 hours a day with FXOpen. Take advantage of low commissions, deep liquidity, and spreads from 0.0 pips. Open your FXOpen account now or learn more about trading forex with FXOpen.
This article represents the opinion of the Companies operating under the FXOpen brand only. It is not to be construed as an offer, solicitation, or recommendation with respect to products and services provided by the Companies operating under the FXOpen brand, nor is it to be considered financial advice.
Latest from Forex Analysis
Latest articles

Anchored VWAP and How You Can Use It in Forex Trading
In the world of forex trading, understanding the nuanced tools at your disposal can significantly enhance decision-making processes. One such sophisticated tool is the Anchored Volume-Weighted Average Price (Anchored VWAP), which refines the standard VWAP by allowing traders to set

META Share Price Collapses after Publication of Quarterly Report
Just yesterday, META's stock price closed at USD 493.50, up approximately 40% since the start of 2024 and up nearly 300% since the start of 2023.
However, following the release of Meta's quarterly report, its shares plummeted to USD

USD/JPY Analysis: The Rate Exceeds The Level of 155 Yen Per US Dollar
Today, the price of USD/JPY once again renewed its 34-year high, exceeding the level of 155 yen per dollar, which put pressure on the current authorities.
According to Reuters, officials are trying to maintain calm in the market.
"We