


FXOpen
AUD/USD is under pressure below the 0.7100 support. Similarly, NZD/USD is at risk of more losses below the 0.6470 support level. Upsides are likely to be capped in the short term in both pairs.
Important Takeaways for AUD/USD and NZD/USD
- The Aussie Dollar broke the key 0.7170 support and declined sharply against the US Dollar.
- There is a major bearish trend line in place with resistance at 0.7090 on the hourly chart of AUD/USD.
- NZD/USD could break down below the 0.6470 and 0.6450 support levels.
- There is a key bearish trend line formed with resistance at 0.6485 on the hourly chart.
AUD/USD Technical Analysis
The Aussie Dollar failed to gain traction above the 0.7250 level and declined sharply against the US Dollar. The AUD/USD pair broke the 0.7170 and 0.7150 support levels to move into a bearish zone.
The decline was such that the pair even surpassed the 0.7100 support and settled below the 50 hourly simple moving average. It traded as low as 0.7065 and later started consolidating in a tiny range.
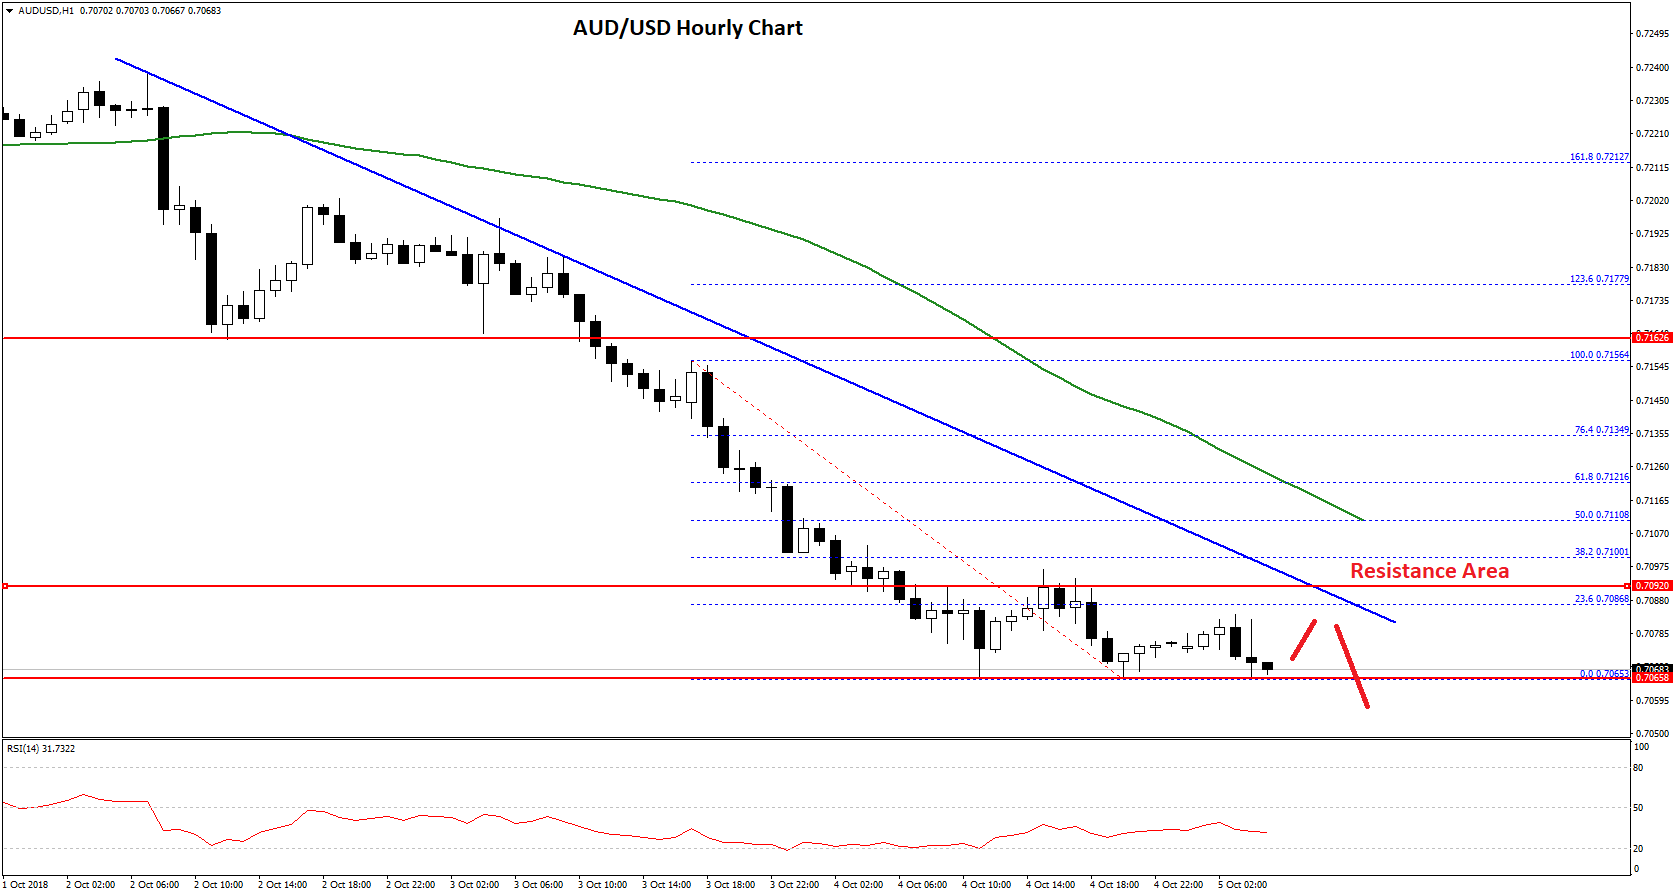
It seems like the pair is struggling to break the 23.6% Fib retracement level of the recent decline from the 0.7156 high to 0.7065 low. More importantly, there is a major bearish trend line in place with resistance at 0.7090 on the hourly chart.
Above the trend line resistance, there is a key resistance formed near the 0.7110 level and the 50 hourly SMA. It also coincides with the 50% Fib retracement level of the recent decline from the 0.7156 high to 0.7065 low.
Therefore, if the pair corrects higher, it is likely to face a strong resistance near the 0.7100-0.7110 zone. A close above the mentioned resistance could open the doors for a larger correction towards the 0.7150 level.
On the downside, there could be heavy declines if sellers push the pair below the 0.7065 low. The next major support is at 0.7020 followed by the all-important 0.7000 handle.
NZD/USD Technical Analysis
The New Zealand Dollar also followed a similar pattern and started a downside move from the 0.6620 swing high against the US Dollar. The NZD/USD pair broke the 0.6575 support level to move into a bearish zone.
During the decline, the pair also broke the 0.6550 and 0.6500 support levels and traded as low as 0.6470 recently. It seems like the pair is under a lot of pressure below the 0.6500 level. An initial resistance is near the 23.6% Fib retracement level of the recent decline from the 0.6509 high to 0.6470 low.
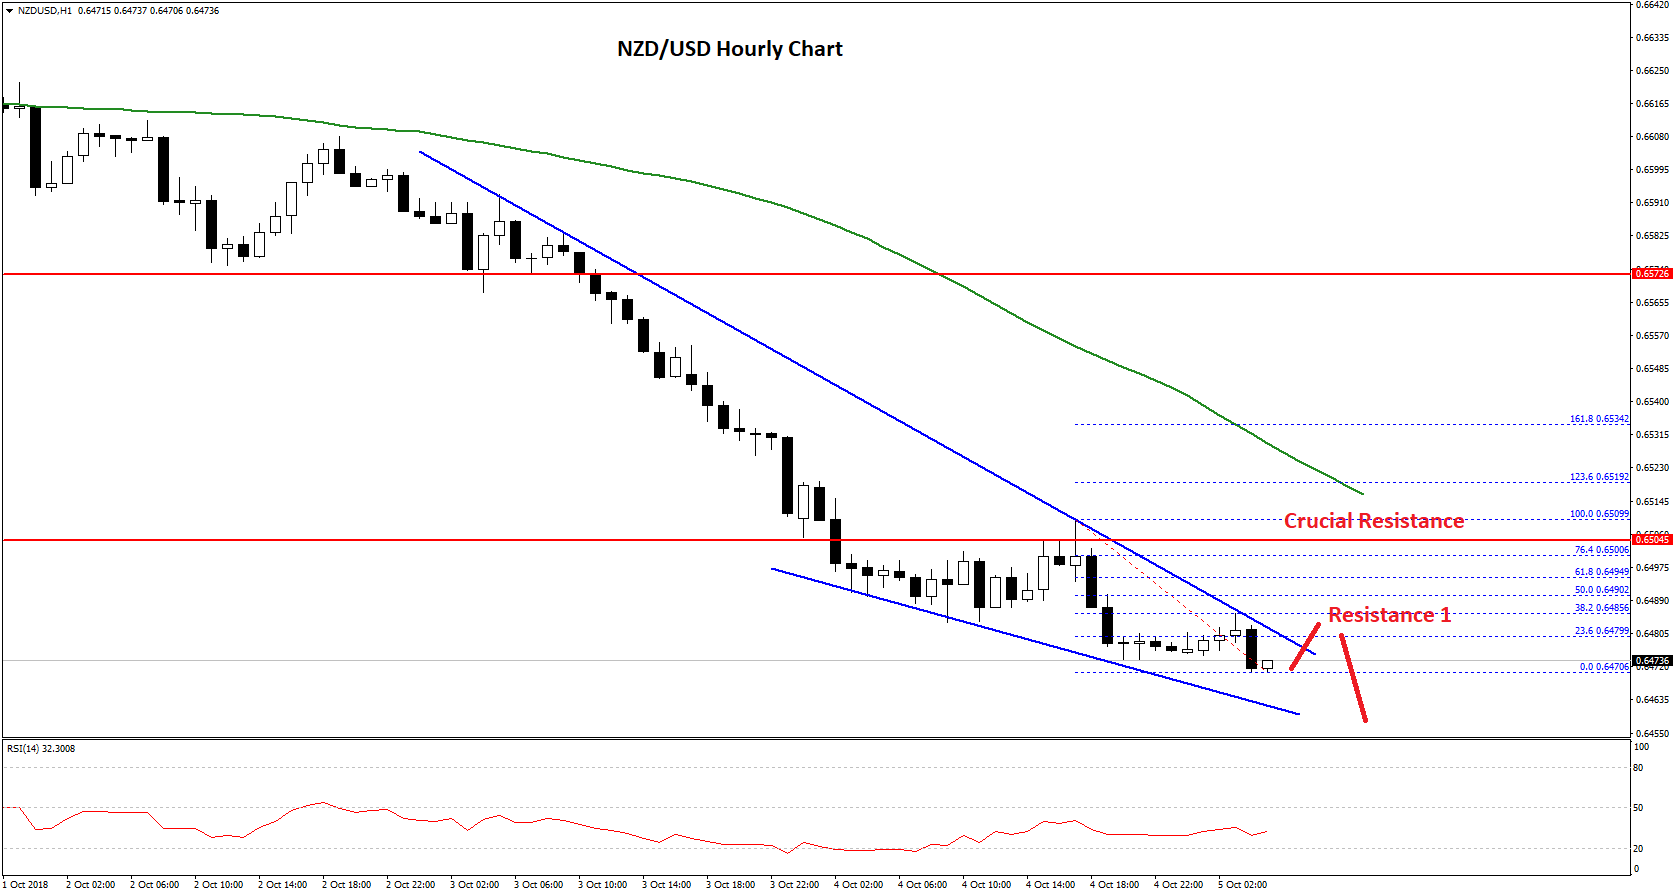
Moreover, there is a key bearish trend line formed with resistance at 0.6485 on the hourly chart. A push above the trend line may well take the pair towards the 0.6500 resistance.
An intermediate resistance is near 0.6490 and the 50% Fib retracement level of the recent decline from the 0.6509 high to 0.6470 low. Above 0.6490 and 0.6500, the next crucial resistance for the current downtrend is at 0.6520 and the 50 hourly simple moving average.
Therefore, if the pair corrects higher, it is likely to face a lot of sellers near the 0.6500 and 0.6520 levels. On the downside, a break below the 0.6470 low may perhaps open the doors for more downsides. The next major supports below 0.6470 are at 0.6450 and 0.6420.
Trade over 50 forex markets 24 hours a day with FXOpen. Take advantage of low commissions, deep liquidity, and spreads from 0.0 pips. Open your FXOpen account now or learn more about trading forex with FXOpen.
This article represents the opinion of the Companies operating under the FXOpen brand only. It is not to be construed as an offer, solicitation, or recommendation with respect to products and services provided by the Companies operating under the FXOpen brand, nor is it to be considered financial advice.
Latest from Forex Analysis
Latest articles

The Price of Gold XAU/USD Shows Strongest Fall in Almost 2 Years
On Monday, the price of gold fell from USD 2,386 to USD 2,333 per ounce — this is the strongest drop in one day in almost 2 years, according to Bloomberg. On Tuesday morning in the Asian session, the

Hong Kong-listed Chinese Insurer Goes on Rally as Western Giants Retract
The Asia Pacific region has once again become an area of great interest to investors and traders as some remarkable patterns of volatility have begun to make their presence felt.
This morning, a few examples of Hong Kong-listed Chinese companies

Bitcoin Price Bullish after Halving-2024
On April 19, 2024, a halving occurred in the Bitcoin network, resulting in the reward for the mined block amounting to 3.125 BTC.
Historically, after the halving (which is associated with a reduction in supply), the price of Bitcoin