


FXOpen

AUD/USD traded towards the 0.7340 zone before starting a downside correction. NZD/USD rallied significantly and it is currently correcting below 0.6880.
Important Takeaways for AUD/USD and NZD/USD
- The Aussie Dollar failed to stay above 0.7300 and started a downside correction against the US Dollar.
- There is a key declining channel forming with resistance near 0.7255 on the hourly chart of AUD/USD.
- NZD/USD surged above 0.6850 and 0.6900 before starting a downside correction.
- There was a break below a major bullish trend line with support near 0.6860 on the hourly chart of NZD/USD.
AUD/USD Technical Analysis
This past week, the Aussie Dollar saw a decent increase above the 0.7150 resistance against the US Dollar. The AUD/USD pair even broke the 0.7200 resistance level to move into a positive zone.
Finally, there was a break above the 0.7300 level, but the pair struggled to clear the 0.7350 resistance zone. The last swing high was formed near 0.7318 on FXOpen before the pair started a downside correction.
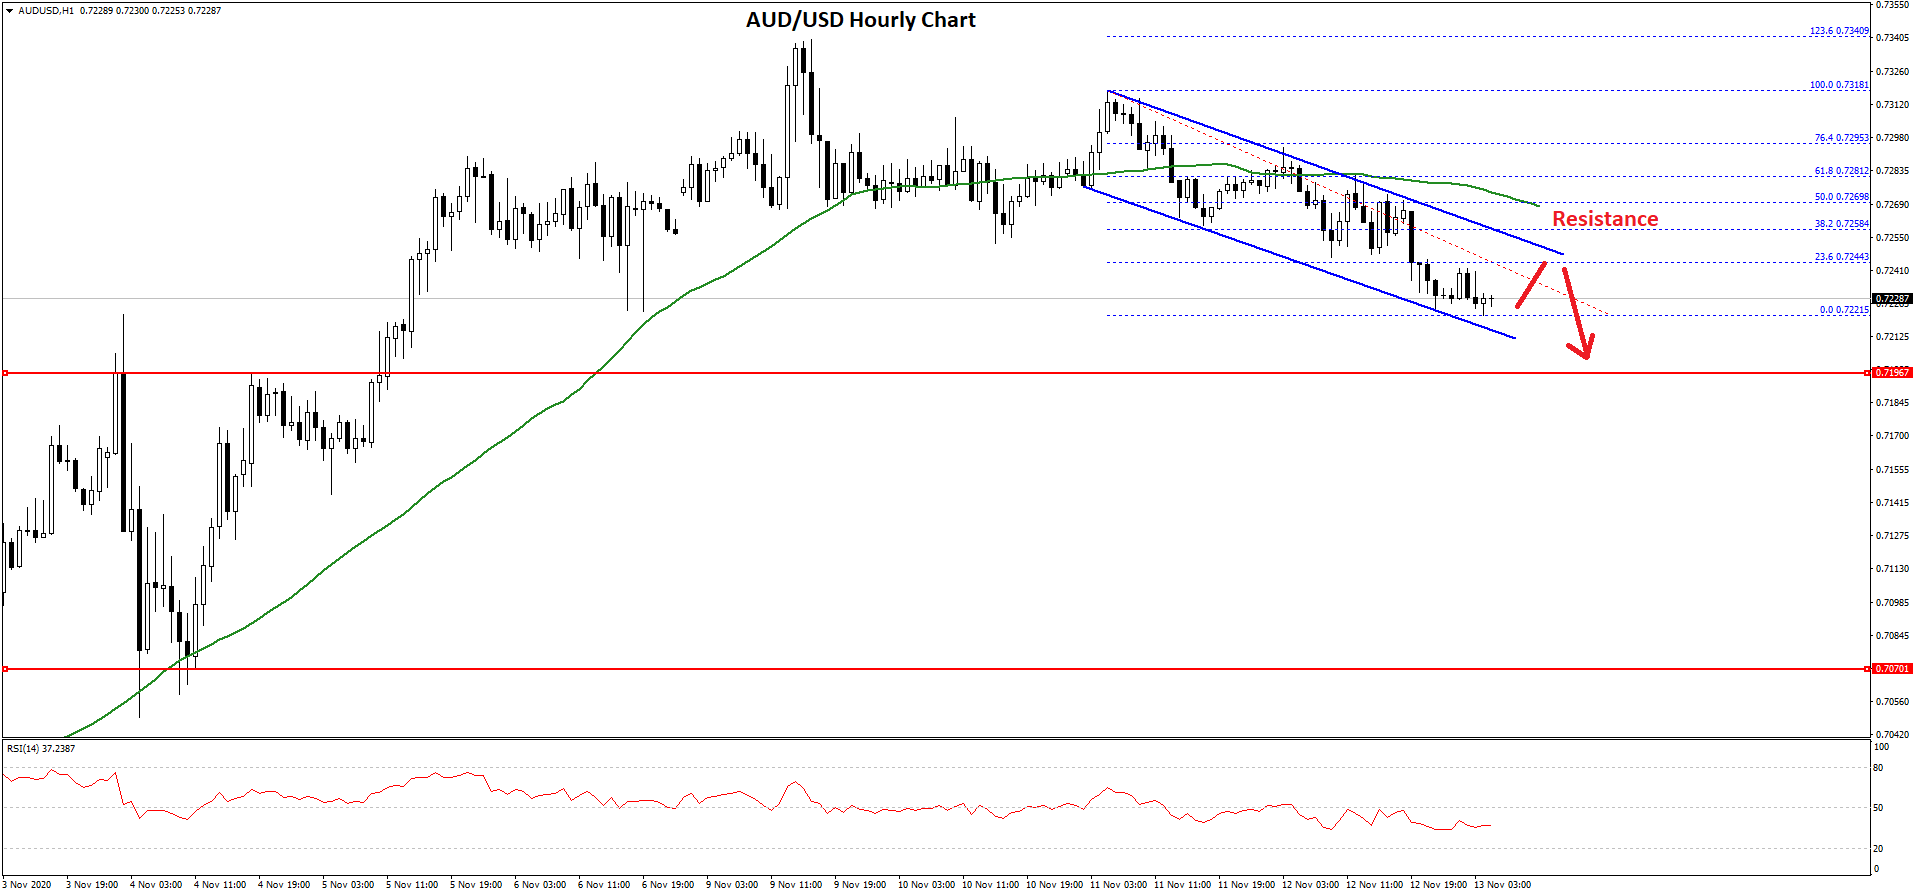
There was a break below the 0.7300 and 0.7280 support levels. The pair even traded 0.7250 and settled below the 50 hourly simple moving average. It traded as low as 0.7221 and currently consolidating losses.
An initial resistance is near the 0.7245 level. It is close to the 23.6% Fib retracement level of the recent decline from the 0.7318 high to 0.7221 low. There is also a key declining channel forming with resistance near 0.7255 on the hourly chart of AUD/USD.
The main resistance is forming near the 0.7270 level and the 50 hourly simple moving average. The 50% Fib retracement level of the recent decline from the 0.7318 high to 0.7221 low is also near 0.7270.
If there is a clear break above the channel resistance and then 0.7270, the pair could revisit the 0.7340 and 0.7350 resistance levels. Conversely, the pair might continue to move down below the 0.7220 support. The next major support is near the 0.7200 level.
Any further losses below the key 0.7200 support level may perhaps open the doors for a larger decline towards the 0.7150 support zone.
NZD/USD Technical Analysis
In the past few days, there was a strong increase in the New Zealand Dollar above the 0.6800 resistance level against the US Dollar. The NZD/USD pair even surged above the 0.6850 and 0.6880 resistance levels.
Finally, there was a spike above the 0.6900 level and the pair traded to a new multi-month high at 0.6914. Recently, there was a downside correction below the 0.6880 support level.
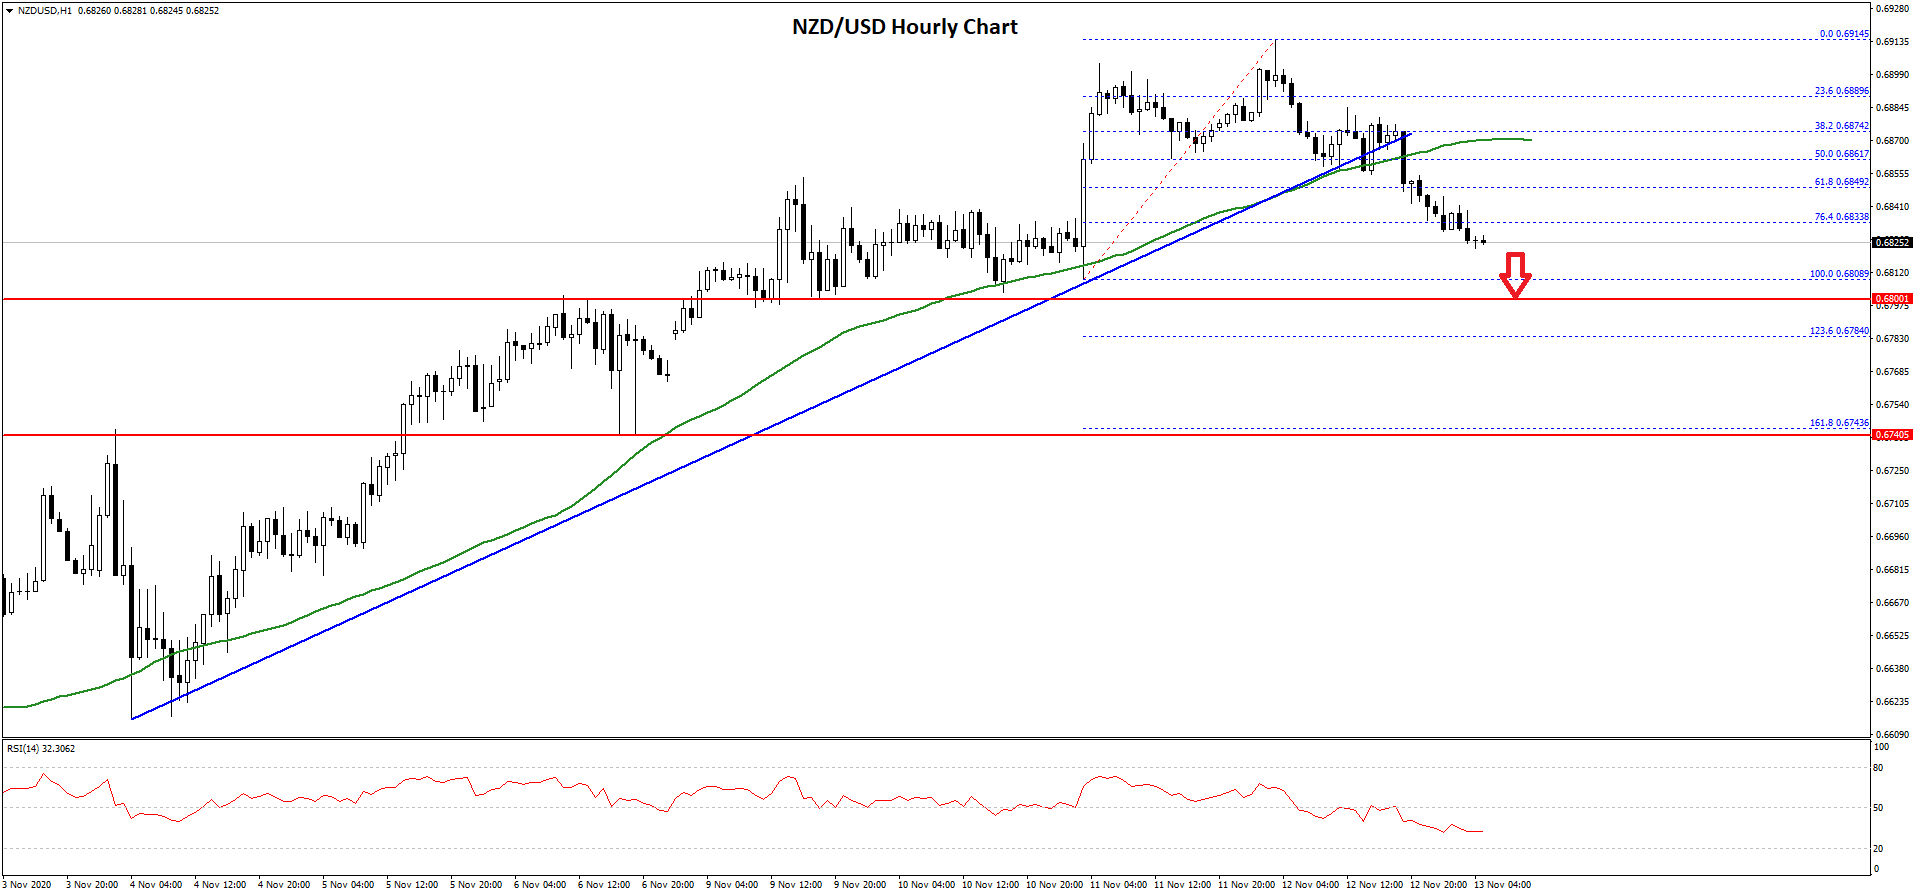
There was a break below the 50 hourly simple moving average at 0.6880. The pair broke the 50% Fib retracement level of the upward move from the 0.6808 swing low to 0.6914 high. Moreover, there was a break below a major bullish trend line with support near 0.6860 on the hourly chart of NZD/USD.
The pair is now trading below the 0.6840 support, plus the 76.4% Fib retracement level of the upward move from the 0.6808 swing low to 0.6914 high. It seems like NZD/USD is approaching the 0.6800 support level, where the bulls might emerge.
Any further losses may perhaps open the doors for a larger decline towards the 0.6750 support. Conversely, the pair could stay above 0.6800 and start a fresh increase above the 0.6840 and 0.6850 resistance levels in the near term.
Trade over 50 forex markets 24 hours a day with FXOpen. Take advantage of low commissions, deep liquidity, and spreads from 0.0 pips. Open your FXOpen account now or learn more about trading forex with FXOpen.
This article represents the opinion of the Companies operating under the FXOpen brand only. It is not to be construed as an offer, solicitation, or recommendation with respect to products and services provided by the Companies operating under the FXOpen brand, nor is it to be considered financial advice.
Latest from Forex Analysis
Latest articles

Weekly Market Wrap With Gary Thomson: UK100, USD, GOLD, OIL
Get the latest scoop on the week's hottest headlines, all in one convenient video. Join Gary Thomson, the COO of FXOpen UK, as he breaks down the most significant news reports and shares his expert insights.
- UK100 Share Index Rises

What Is a Darvas Box Theory and How Does It Work in Trading?
The Darvas Box Theory, pioneered by Nicolas Darvas in the 1950s, has transcended its stock market origins to become a valuable tool for forex traders. This method leverages specific price movements and patterns, known as the Darvas Box, to track

NFLX Stock Price Falls Despite Subscriber Growth
Yesterday, after the close of the main trading session on the stock market, Netflix reported to investors for the 1st quarter of 2024.
The report turned out better than expected:
→ earnings per share: actual = USD 5.28, forecast = USD 4.