


FXOpen

AUD/USD started a fresh decline after it failed near the 0.6600 resistance zone. Similarly, NZD/USD is currently declining and trading below the key 0.6120 support zone.
Important Takeaways for AUD/USD and NZD/USD
- The Aussie Dollar formed a short term top near 0.6616 and declined recently against the US Dollar.
- There was a break below a major bullish trend line with support near 0.6550 on the hourly chart of AUD/USD.
- NZD/USD is also showing and it is now trading below the 0.6120 support zone.
- There was a break below a key bullish trend line with support at 0.6110 on the hourly chart of NZD/USD.
AUD/USD Technical Analysis
The Aussie Dollar followed a bullish past above the 0.6500 pivot level s against the US Dollar. The AUD/USD pair even broke the 0.6550 resistance, but it struggled to stay above the 0.6600 level.
The pair formed a short term top near 0.6616 on FXOpen and recently started a fresh decline. It broke the 0.6600 and 0.6580 levels to enter a bearish zone. Besides, there was a close below the 0.6550 level and the 50 hourly simple moving average.
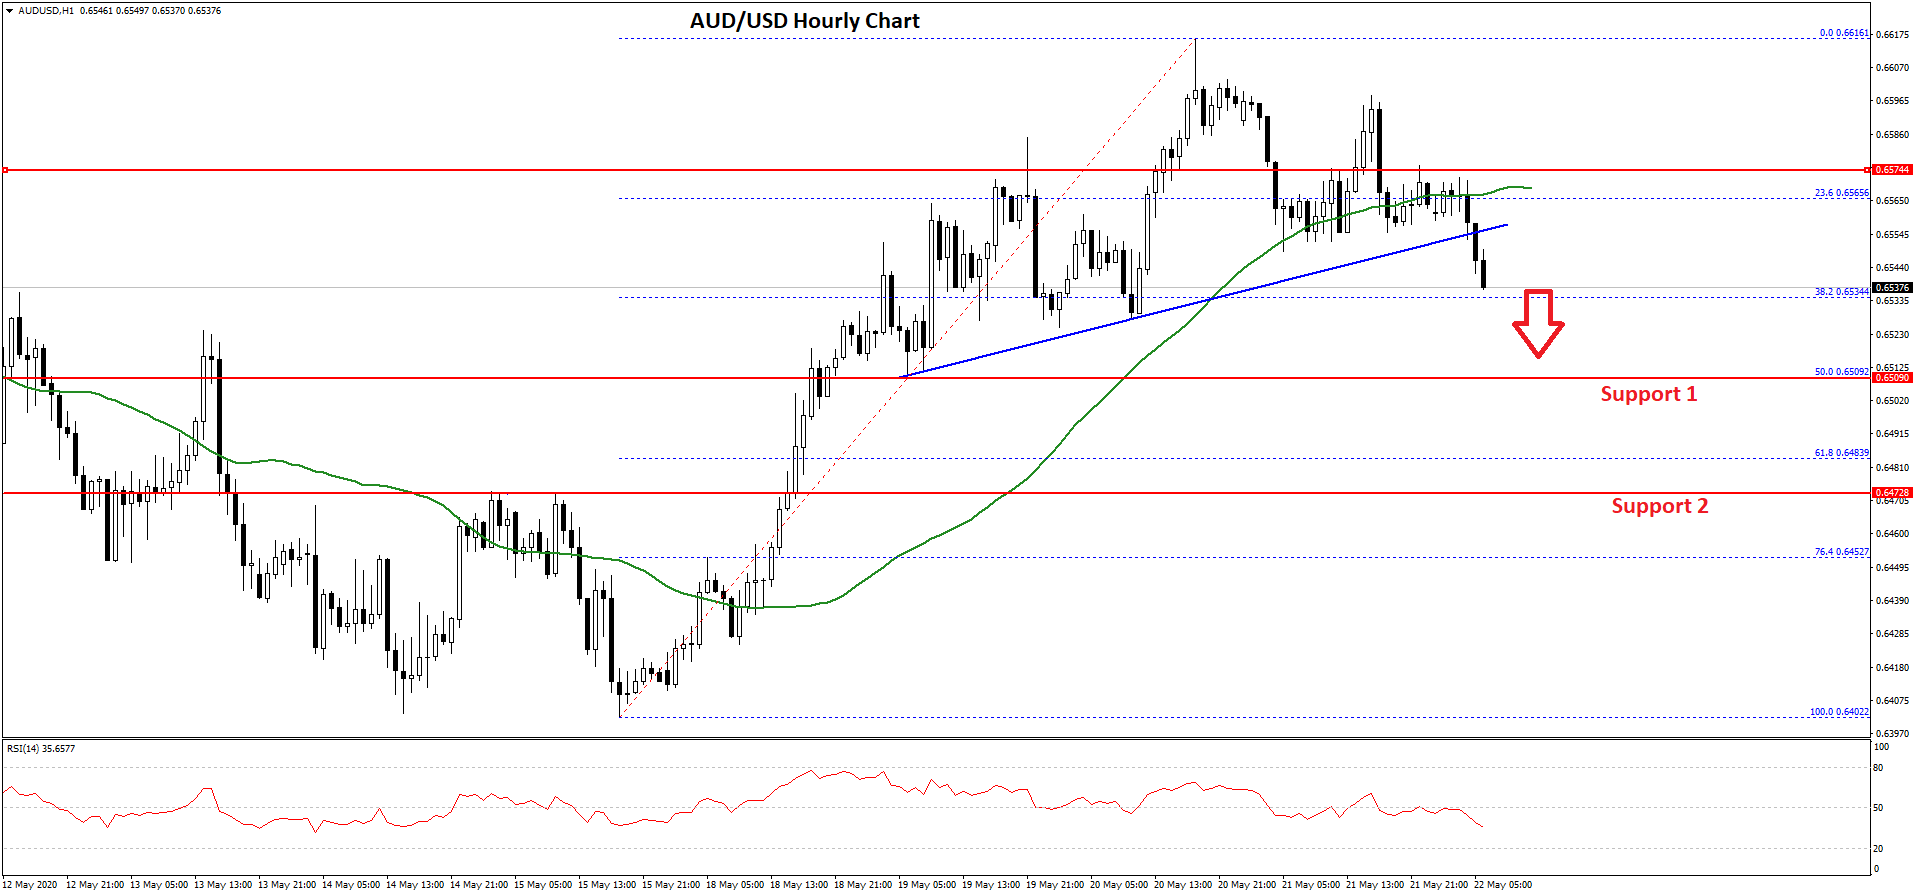
More importantly, there was a break below a major bullish trend line with support near 0.6550 on the hourly chart of AUD/USD. The pair is now trading below the 0.6540 level and testing the 38.2% Fib retracement level of the upward move from the 0.6402 low to 0.6616 high.
On the downside, the first key support is near the 0.6510 level. It is close to the 50% Fib retracement level of the upward move from the 0.6402 low to 0.6616 high.
If AUD/USD fails to stay above the 0.6610 support, it is likely to continue lower towards the 0.6480 and 0.6450 support levels. On the upside, there is a key resistance forming near the 0.6555 level and the 50 hourly simple moving average.
Therefore, the pair must recover above 0.6550 and 0.6560 to start a fresh increase towards the 0.6600 level in the near term.
NZD/USD Technical Analysis
The New Zealand Dollar also followed a similar path and started a fresh decline from the 0.6158 high against the US Dollar. The NZD/USD pair traded below the 0.6140 and 0.6120 support levels to enter a short term bearish zone.
During the decline, it even broke the 50 hourly simple moving average. It is now testing the 23.6% Fib retracement level of the upward move from the 0.5921 low to 0.6158 high.
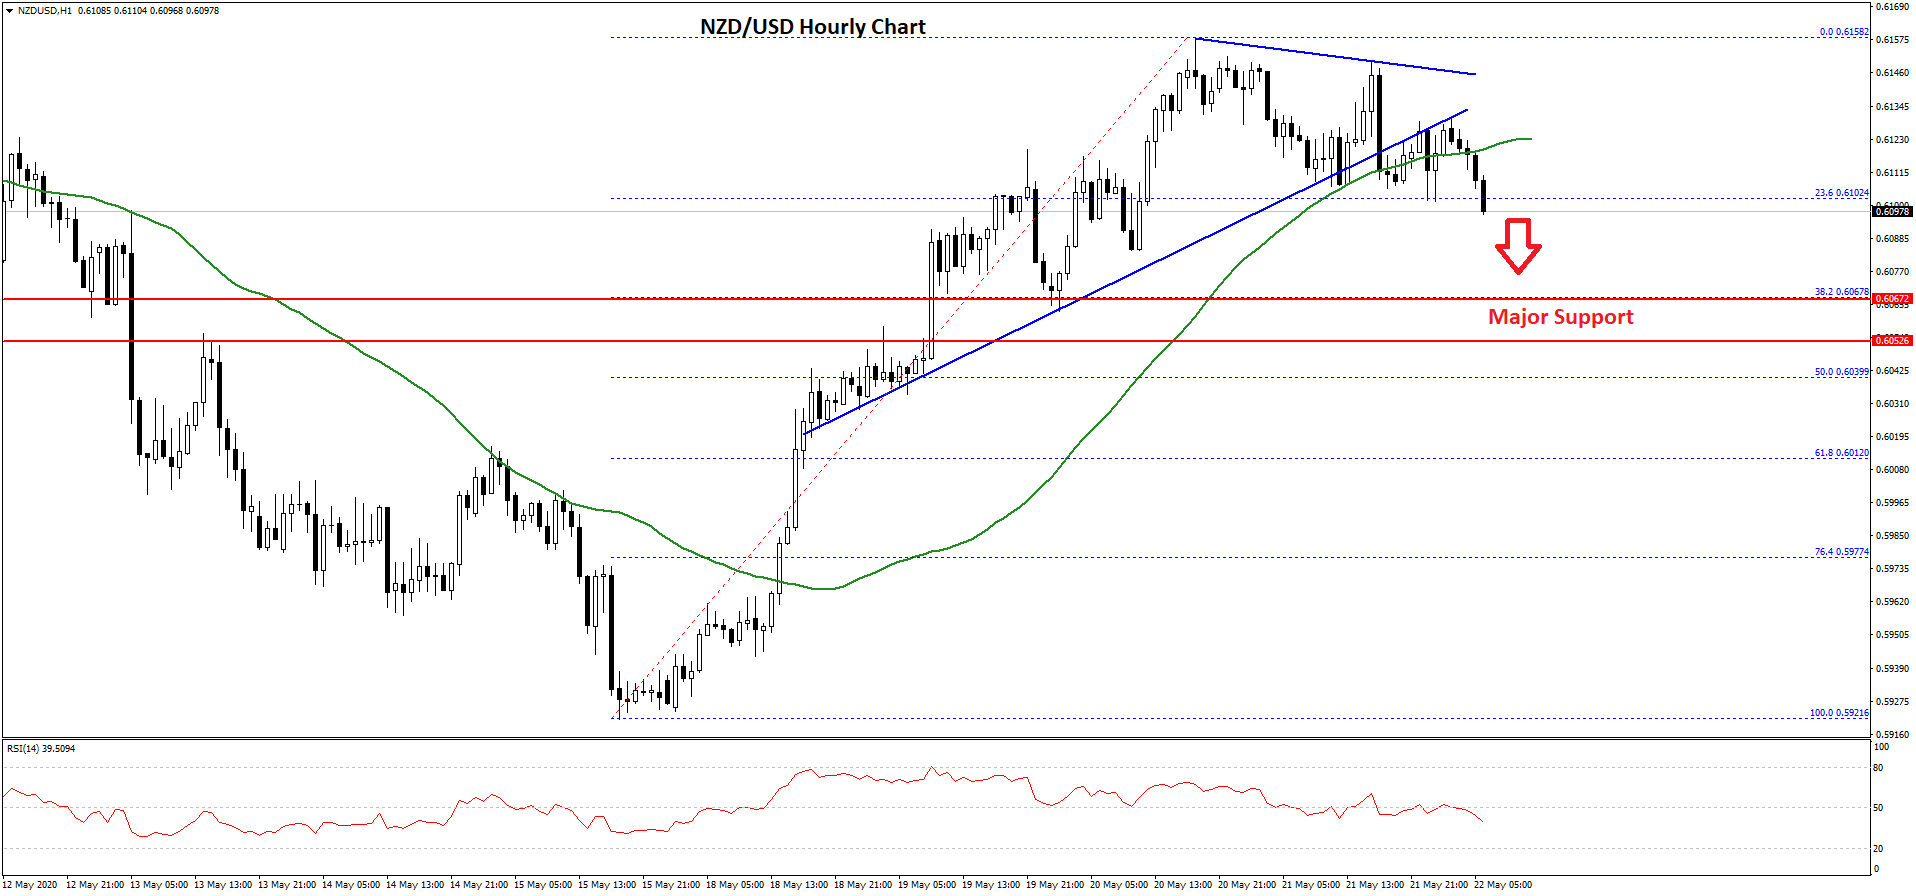
During the decline, there was a break below a key bullish trend line with support at 0.6110 on the hourly chart of NZD/USD. An initial support on the downside is seen near the 0.6100 level.
The first major support is near the 0.6070 level (the last breakout zone). Any further losses could lead the pair towards the 0.6050 support or the 50% Fib retracement level of the upward move from the 0.5921 low to 0.6158 high.
On the upside, an initial resistance is seen near the 0.6125 level and the 50 hourly simple moving average. However, the main resistance is still near 0.6150, above which NZD/USD might rise towards the 0.6200 resistance zone.
Overall, there are chances of more losses towards 0.6080 or 0.6050 before the pair attempts a fresh increase in the near term.
Trade over 50 forex markets 24 hours a day with FXOpen. Take advantage of low commissions, deep liquidity, and spreads from 0.0 pips. Open your FXOpen account now or learn more about trading forex with FXOpen.
This article represents the opinion of the Companies operating under the FXOpen brand only. It is not to be construed as an offer, solicitation, or recommendation with respect to products and services provided by the Companies operating under the FXOpen brand, nor is it to be considered financial advice.
Latest from Forex Analysis
Latest articles

How to Identify and Trade Liquidity Grabs
Understanding the intricacies of market liquidity and the role of liquidity grabs can be crucial for optimising trading strategies. Liquidity grabs, creating rapid price movements, are a key component of Smart Money trading. This article explores how to identify these

What Is a Piercing Line Pattern, and How Can You Trade with It?
In the world of technical analysis, the piercing line pattern stands out as a solid indicator of potential market reversals. This article delves into the nuances of this two-candlestick pattern, exploring its formation, significance, and how traders can effectively leverage

London Calling! FTSE 100 Stocks Flying High Once Again
Back in 2021, which when looking at a physical calendar does not seem such a long time ago yet feels like an epoch ago when considering the changes in global economies and the capital markets since then, the FTSE 100