


FXOpen

AUD/USD failed to clear the 0.7800 resistance and corrected lower. NZD/USD is likely to extend losses if there is a clear break below the 0.7150 support.
Important Takeaways for AUD/USD and NZD/USD
- The Aussie Dollar failed to gain strength above the 0.7800 level against the US Dollar.
- There is a key bearish trend line forming with resistance near 0.7730 on the hourly chart of AUD/USD.
- NZD/USD corrected lower and it is now testing the 0.7150 support zone.
- There was a break below a major contracting triangle with support near 0.7180 on the hourly chart of NZD/USD.
AUD/USD Technical Analysis
After a steady increase, the Aussie Dollar struggled above the 0.7800 level against the US Dollar. The AUD/USD pair traded as high as 0.7815 on FXOpen and it recently started a fresh decline.
There was a break below the 0.7780 and 0.7750 support levels. The pair even settled below the 0.7750 level and the 50 hourly simple moving average. It traded as low as 0.7689 and it is now correcting losses.
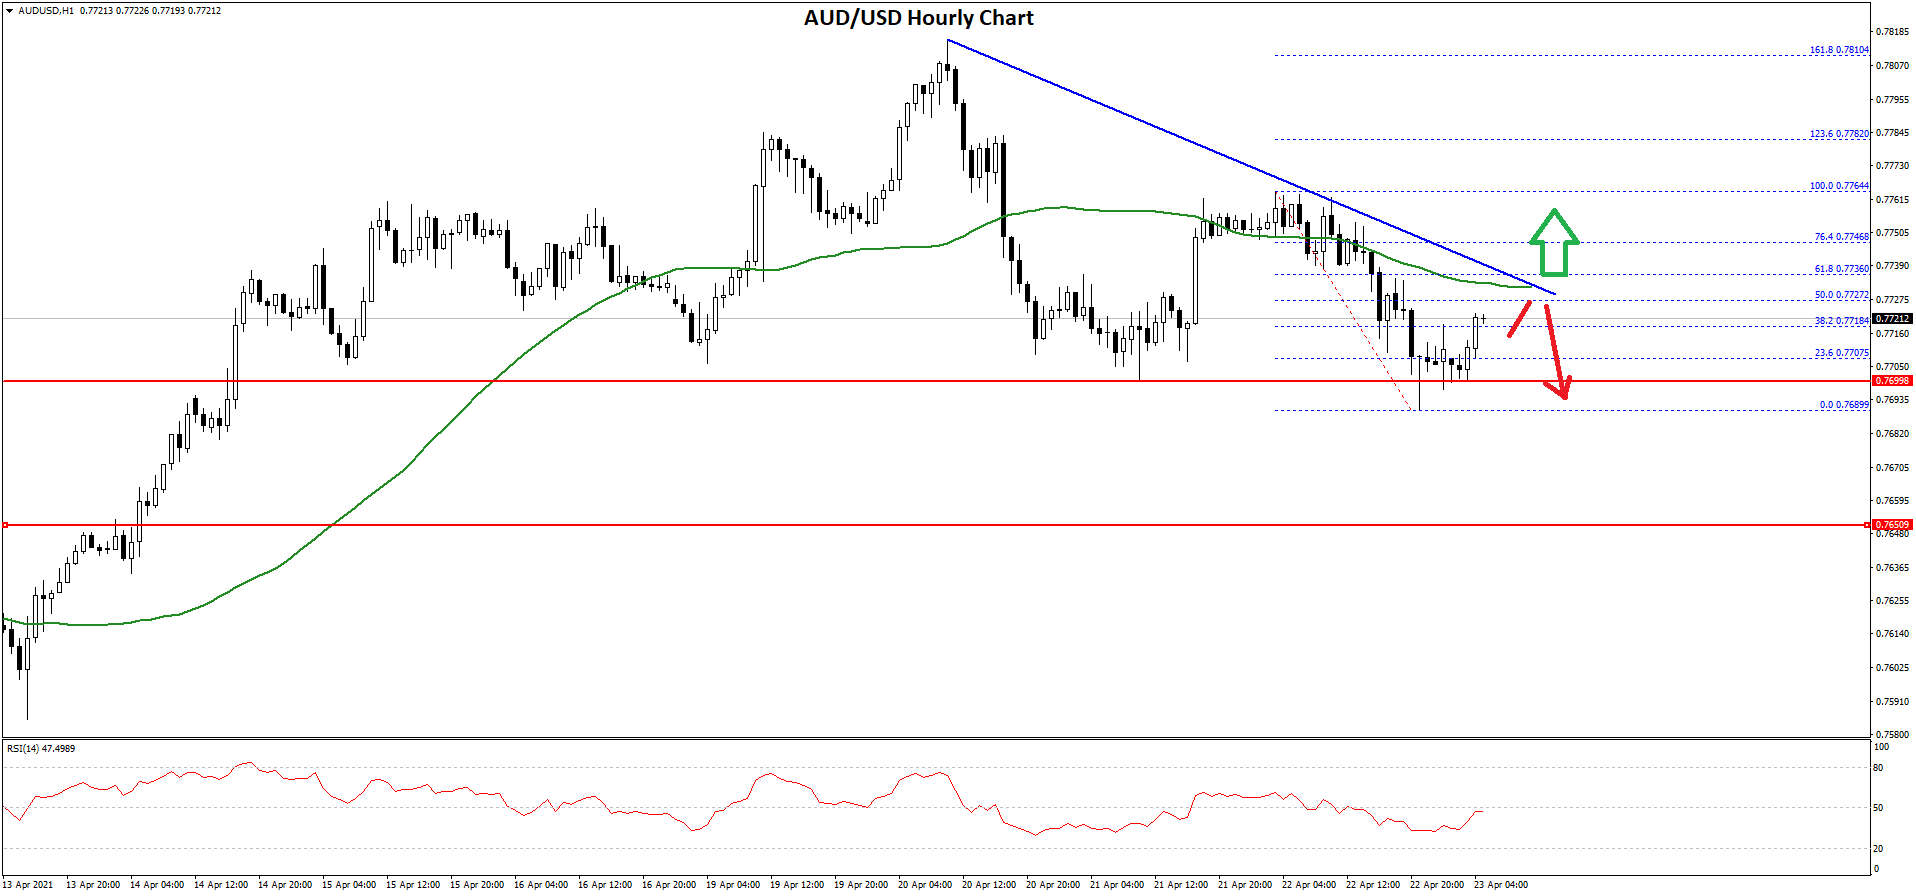
It broke the 23.6% Fib retracement level of the downward move from the 0.7764 swing high to 0.7689 low. On the upside, there is a major resistance forming near the 0.7725 and 0.7730 levels. There is also a key bearish trend line forming with resistance near 0.7730 on the hourly chart of AUD/USD.
The trend line is close to the 50% Fib retracement level of the downward move from the 0.7764 swing high to 0.7689 low. The 50 hourly simple moving average is also near the trend line.
Therefore, a clear break above the trend line and 0.7730 is must for a steady increase. The next major resistance could be 0.7750, above which the price could rise towards the 0.7800 resistance.
Conversely, the pair could decline below the 0.7700 support zone. If there is a downside break below the 0.7700 and 0.7685 levels, the pair could extend its decline towards the 0.7650 level.
NZD/USD Technical Analysis
The New Zealand Dollar also followed a similar path and declined after it failed to clear the 0.7230 zone against the US Dollar. The NZD/USD pair broke the 0.7200 support zone to move into a short-term bearish zone.
There was also a break below a major contracting triangle with support near 0.7180 on the hourly chart of NZD/USD. The pair even settled below the 0.7150 support level and the 50 hourly simple moving average.
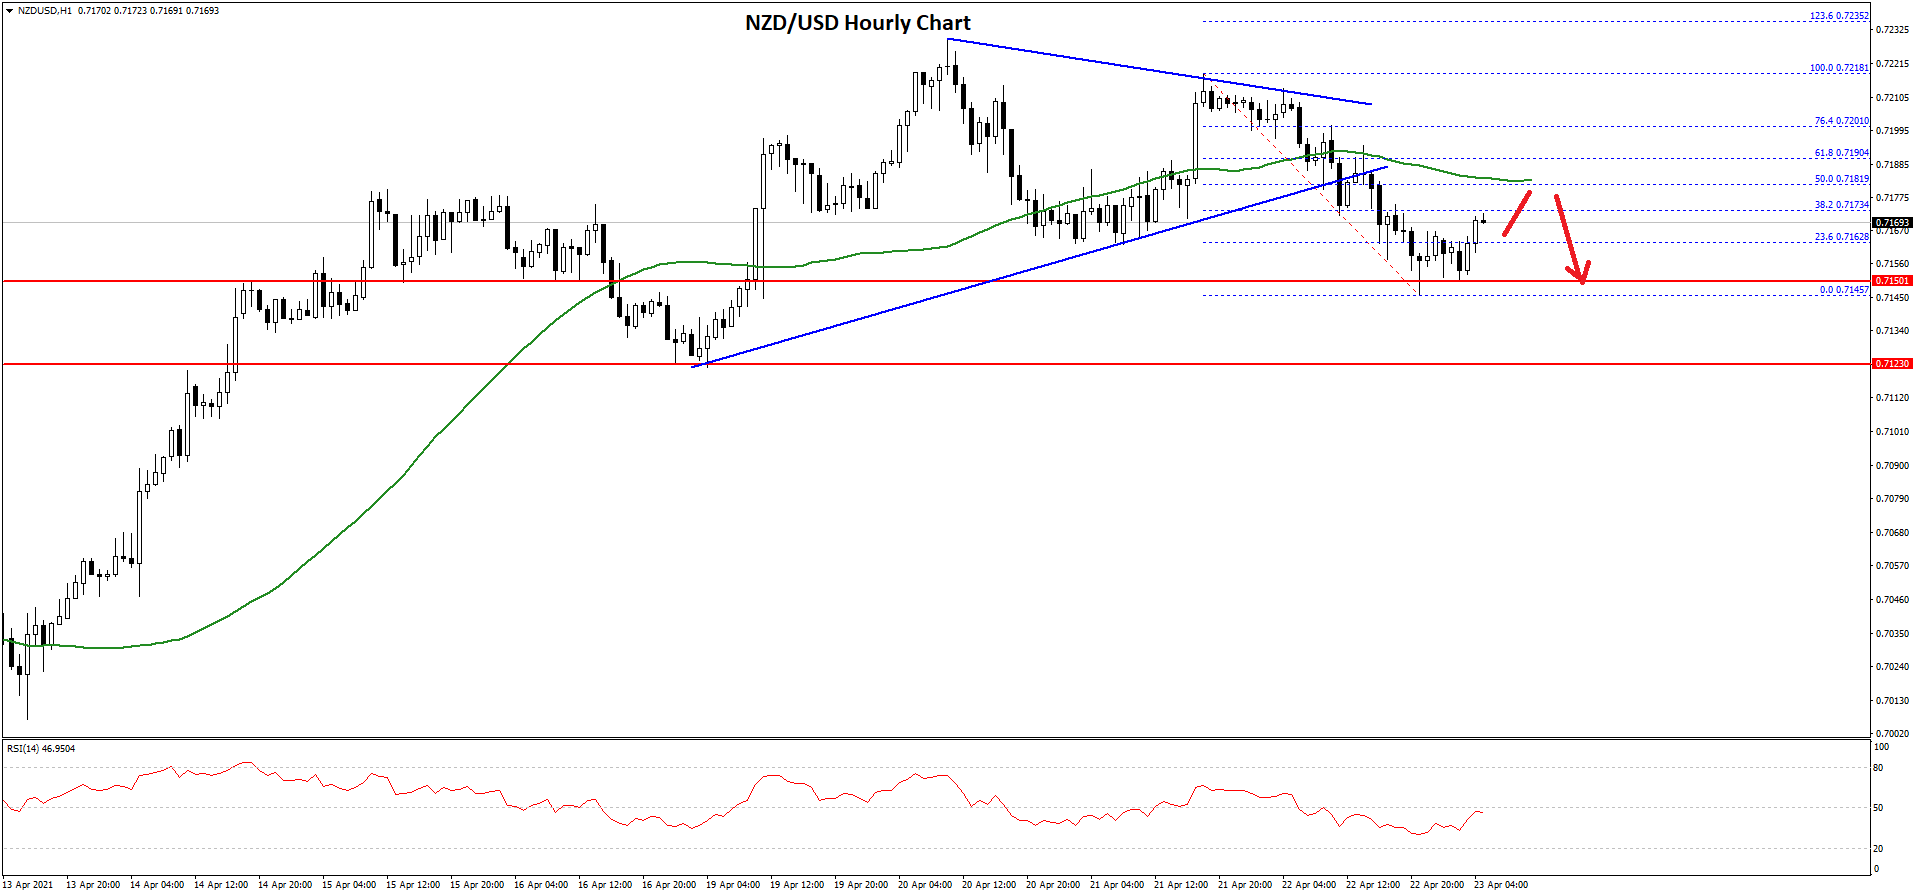
A low is formed near 0.7145 and the pair is now correcting higher. It traded above the 23.6% Fib retracement level of the recent decline from the 0.7218 high to 0.7145 low.
On the upside, there is a major resistance forming near the 0.7180 level and the 50 hourly simple moving average. It is near the 50% Fib retracement level of the recent decline from the 0.7218 high to 0.7145 low.
A clear upside break above the 0.7180 resistance and the 50 hourly SMA could open the doors for a fresh move towards the 0.7200 level. Any more gains might lead the pair towards the 0.7230 resistance zone.
Conversely, the pair could continue to move down below the 0.7150 support. If NZD/USD breaks the 0.7145 low, it is likely to accelerate lower towards the 0.7100 level.
This forecast represents FXOpen Markets Limited opinion only, it should not be construed as an offer, invitation or recommendation in respect to FXOpen Markets Limited products and services or as financial advice.
Trade over 50 forex markets 24 hours a day with FXOpen. Take advantage of low commissions, deep liquidity, and spreads from 0.0 pips. Open your FXOpen account now or learn more about trading forex with FXOpen.
This article represents the opinion of the Companies operating under the FXOpen brand only. It is not to be construed as an offer, solicitation, or recommendation with respect to products and services provided by the Companies operating under the FXOpen brand, nor is it to be considered financial advice.
Latest from Forex Analysis
Latest articles

What Order Imbalance Is and How To Use It in a Trading Strategy
Understanding the nuances of order imbalances is key for traders looking to navigate the ebb and flow of asset prices. Order imbalances provide a clear window into the supply and demand dynamics at play, offering strategic insights. This article delves

XAU/USD Gold Price Reaches an Important Resistance Zone
The XAU/USD gold chart today indicates that the historical record price of the metal is above USD 2,400 per ounce.
In addition to fears of a new round of inflation due to rising commodity prices, geopolitical tensions are

What Is a Break of Structure and How Can You Trade It?
In the ever-evolving world of Smart Money Concept (SMC) trading, a nuanced understanding of market dynamics is indispensable. This article explores the concept of Break of Structure (BOS), how to identify it, and its implications for trading strategies, setting traders