


FXOpen
AUD/USD found a strong support near the 0.6960 level and recovered recently. NZD/USD is trading nicely and it could recover towards the 0.6650 level in the near term.
Important Takeaways for AUD/USD and NZD/USD
- The Aussie Dollar remained well supported above 0.6960 and recently bounced back against the US Dollar.
- There was a break above a key bearish trend line with resistance at 0.6990 on the hourly chart of AUD/USD.
- NZD/USD dipped strongly towards the 0.6525 level and later bounced back above 0.6570.
- There was a break above a major declining channel with resistance at 0.6595 on the hourly chart.
AUD/USD Technical Analysis
After a strong decline, the Aussie Dollar found support near the 0.6960 area against the US Dollar. The AUD/USD pair started a strong upward move and traded above the 0.6985 and 0.6700 resistance levels.
The hourly chart suggests that the pair traded as low as 0.6964 on FXOpen and recently climbed sharply above the 0.7000 level and the 50 hourly simple moving average.
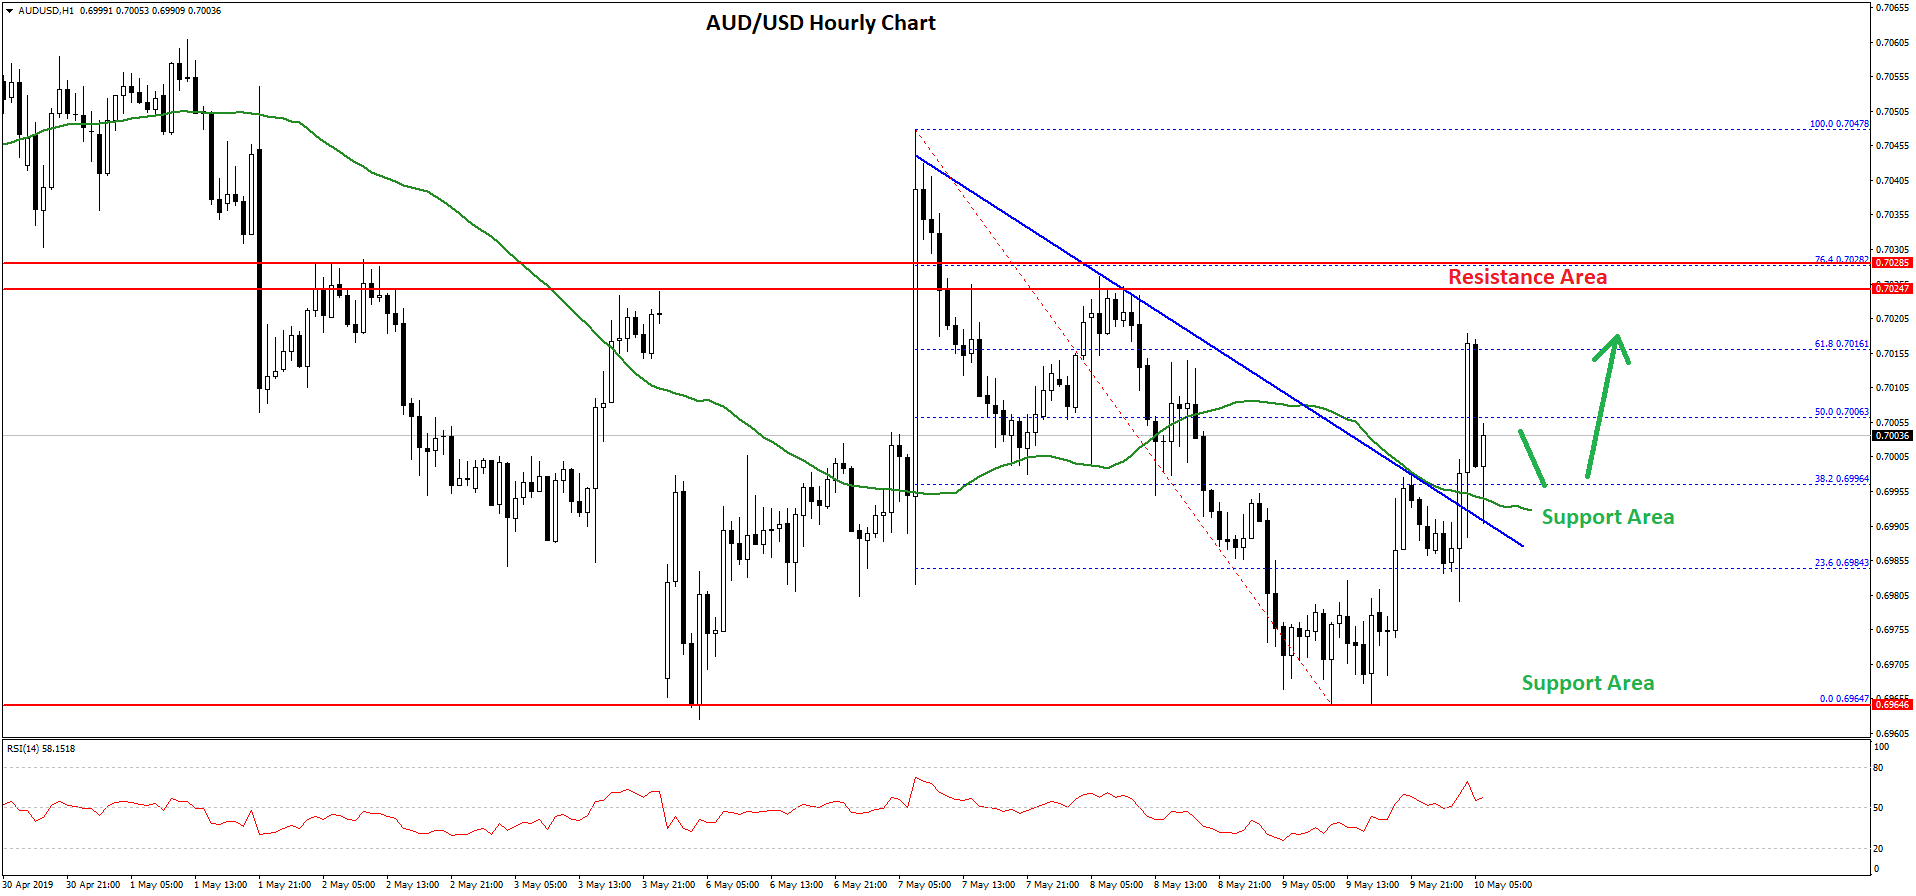
During the upside move, the pair broke the 50% Fib retracement level of the last decline from the 0.7047 high to 0.6964 low. Moreover, there was a break above a key bearish trend line with resistance at 0.6990 on the hourly chart of AUD/USD.
The pair tested the 76.4% Fib retracement level of the last decline from the 0.7047 high to 0.6964 low. It retreated from highs and tested the broken resistance near 0.6990 and the 50 hourly simple moving average.
The bulls seem to be protecting declines below the 0.7000 and 0.6990 support levels. As long as the pair is above 0.6990, the pair could bounce back.
On the upside, an initial resistance is near the 0.7015 level. However, the main resistances on the upside are near the 0.7030 and 0.7040 levels.
NZD/USD Technical Analysis
The New Zealand Dollar declined steadily from the 0.6680 resistance area against the US Dollar. The NZD/USD pair came under a lot of pressure and broke the 0.6600 and 0.6560 support levels.
The decline was such that the pair declined below 0.6540 and traded as low as 0.6527. Finally, there was a sharp rebound and the pair recovered above the 0.6580 level.
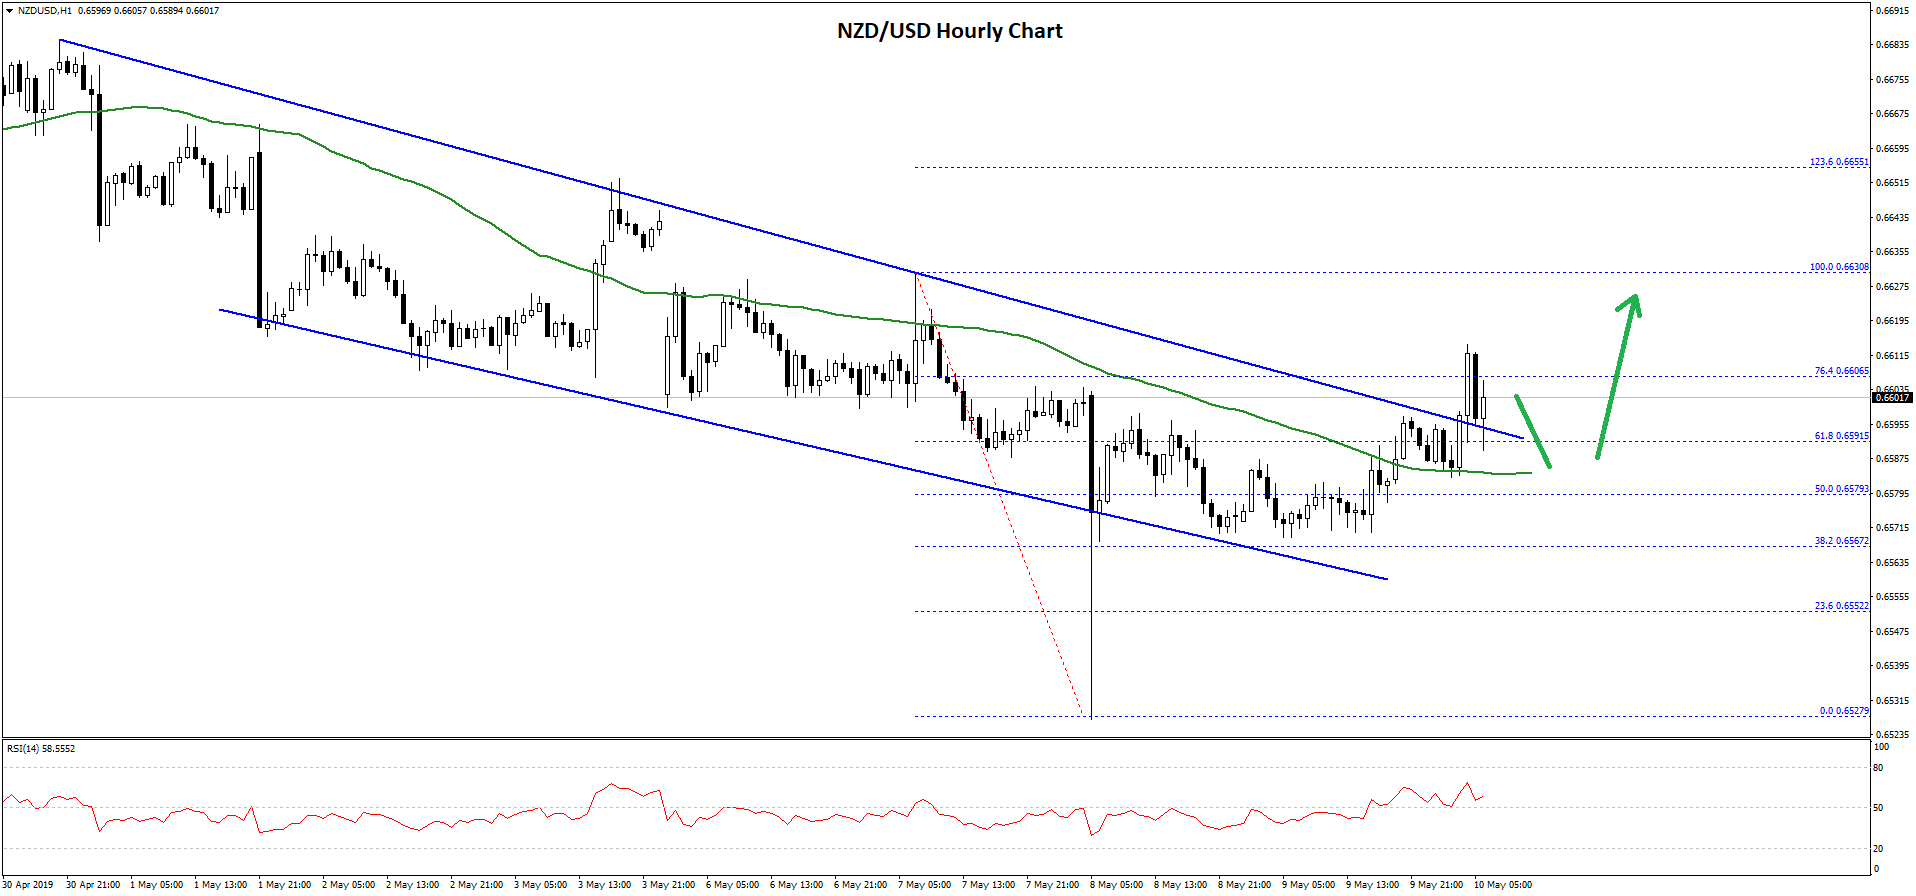
During the recent recovery, there was a break above a major declining channel with resistance at 0.6595 on the hourly chart. The pair settled above the 0.6600 level and the 50 hourly simple moving average.
Moreover, it tested the 76.4% Fib retracement level of the last decline from the 0.6630 high to 0.6527 low. However, the upside move was capped by the 0.6618-0.6620 zone. As a result, the pair is currently correcting gains and trading near the broken channel at 0.6595.
If the pair starts a fresh upward move, there could be a break above the 0.6620 level. The next key resistance on the upside is near the 0.6630 level or the previous swing high.
On the downside, an initial support is near the 0.6595 level and the 50 hourly SMA. If there is a downside break below 0.6590, the pair could decline or extend losses towards the next key support at 0.6570 in the coming sessions.
Trade over 50 forex markets 24 hours a day with FXOpen. Take advantage of low commissions, deep liquidity, and spreads from 0.0 pips. Open your FXOpen account now or learn more about trading forex with FXOpen.
This article represents the opinion of the Companies operating under the FXOpen brand only. It is not to be construed as an offer, solicitation, or recommendation with respect to products and services provided by the Companies operating under the FXOpen brand, nor is it to be considered financial advice.
Latest from Forex Analysis
Latest articles

Anchored VWAP and How You Can Use It in Forex Trading
In the world of forex trading, understanding the nuanced tools at your disposal can significantly enhance decision-making processes. One such sophisticated tool is the Anchored Volume-Weighted Average Price (Anchored VWAP), which refines the standard VWAP by allowing traders to set

META Share Price Collapses after Publication of Quarterly Report
Just yesterday, META's stock price closed at USD 493.50, up approximately 40% since the start of 2024 and up nearly 300% since the start of 2023.
However, following the release of Meta's quarterly report, its shares plummeted to USD

USD/JPY Analysis: The Rate Exceeds The Level of 155 Yen Per US Dollar
Today, the price of USD/JPY once again renewed its 34-year high, exceeding the level of 155 yen per dollar, which put pressure on the current authorities.
According to Reuters, officials are trying to maintain calm in the market.
"We