


FXOpen
AUD/USD declined after it failed to break the 0.7150 resistance. NZD/USD remains supported above the 0.6530 level, but it is facing the key resistance at 0.6570.
Important Takeaways for AUD/USD and NZD/USD
- The Aussie Dollar declined below the 0.7120 support level recently against the US Dollar.
- There was a break below a major bullish trend line with support at 0.7115 on the hourly chart of AUD/USD.
- NZD/USD remains well supported above the 0.6530-40 zone.
- There is a connecting bearish trend line formed with resistance at 0.6570 on the hourly chart.
AUD/USD Technical Analysis
The Aussie Dollar failed on many occasions to break the 0.7150 level against the US Dollar. As a result, the AUD/USD pair started a downside move and broke the 0.7140 and 0.7120 support levels.
The pair faced an increased selling pressure below the 0.7120 support as it settled below the 50 hourly simple moving average. Moreover, there was a break below a major bullish trend line with support at 0.7115 on the hourly chart, which opened the doors for more losses.
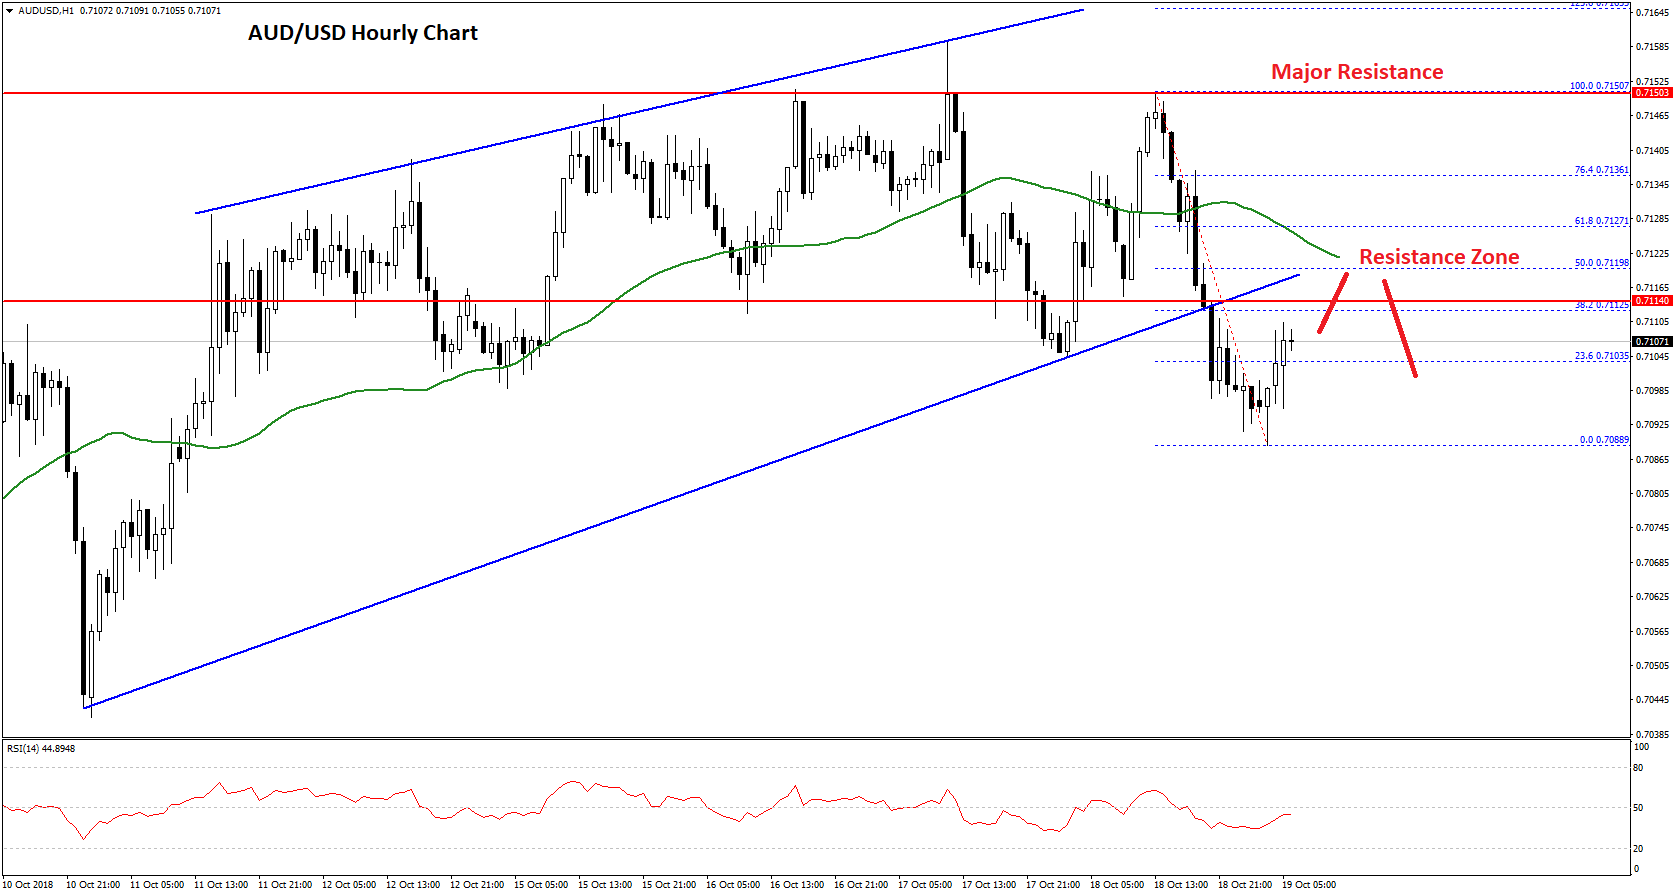
The pair traded below the 0.7100 support as well and formed a low at 0.7088. Later, the pair started an upside correction and moved above the 0.7100 level.
Moreover, there was a break above the 23.6% Fib retracement level of the recent decline from the 0.7150 high to 0.7088 low. However, there are many hurdles on the upside, starting with the 0.7120 level and the 50 hourly SMA.
An immediate resistance is the 50% Fib retracement level of the recent decline from the 0.7150 high to 0.7088 low at 0.7119. Above, 0.7120, the pair is likely to revisit the 0.7150 resistance area, which may once again prevent upsides.
On the downside, the 0.7100 support is a decent support. If there is a solid push below the 0.7100 and 0.7088 levels, there could be more losses towards the 0.7060 level in the near term.
NZD/USD Technical Analysis
The New Zealand Dollar traded close to the 0.6600 level recently against the US Dollar. The NZD/USD pair failed to gain momentum above the 0.6590 level and started a downside move.
The pair declined sharply and broke the 0.6580 and 0.6550 support levels. It traded as low as 0.6523 and settled below the 50 hourly simple moving average. Later, there was an upside correction and the pair jumped above the 0.6550 level.
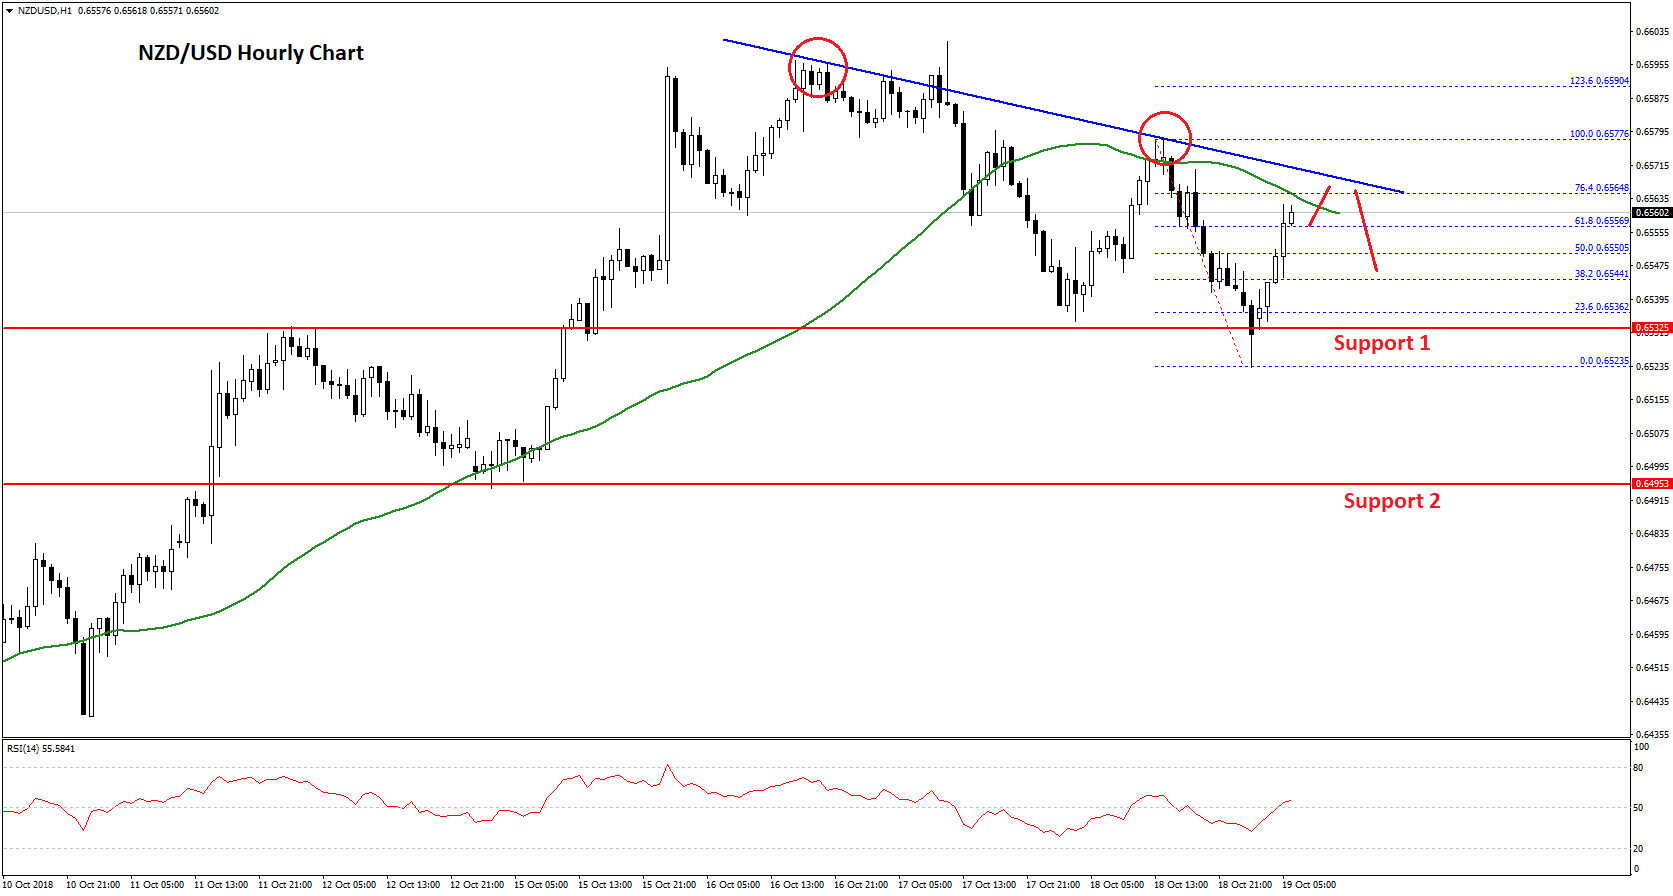
More importantly, there was a break above the 50% Fib retracement level of the recent decline from the 0.6577 high to 0.6523 low. However, there is a key resistance near the 0.6570 level and the 50 hourly SMA.
There is also a connecting bearish trend line formed with resistance at 0.6570 on the hourly chart. The pair must break the 0.6570 resistance and the 50 hourly SMA to revisit the 0.6590-0.6600 resistance zone.
If the pair fails to move past 0.6570 or 0.6590, there could be a fresh downside move in the near term. On the downside, an initial support is at 0.6530, below which there is a risk of a downside break towards the 0.6500 handle.
On the other hand, if buyers push the NZD/USD pair above the 0.6590 and 0.6600 resistance levels, there may well be a solid rise towards the 0.6640 and 0.6650 levels in the near term.
Trade over 50 forex markets 24 hours a day with FXOpen. Take advantage of low commissions, deep liquidity, and spreads from 0.0 pips. Open your FXOpen account now or learn more about trading forex with FXOpen.
This article represents the opinion of the Companies operating under the FXOpen brand only. It is not to be construed as an offer, solicitation, or recommendation with respect to products and services provided by the Companies operating under the FXOpen brand, nor is it to be considered financial advice.
Latest from Forex Analysis
Latest articles

Google Share Price Rose Post-market to a New All-time Record
Yesterday, after the close of the main trading session, a report on activities for the 1st quarter of Alphabet Inc. (Google's parent company) was published. The report was strong, exceeding investors' expectations.
→ Quarterly EPS = USD 1.89 (expected = USD 1.

S&P 500 Rebounds after Negative GDP News
Data released yesterday showed US GDP growth slowed to 1.6% in the first quarter of the year. According to ForexFactory: forecast = 2.2%, past value = 2.4%.
Reaction to the news sent the S&P 500 mini stock

GBP/USD And USD/CAD Daily Chart Outlook
GBP/USD is attempting a recovery wave from 1.2300. USD/CAD is consolidating and might aim for a move above the 1.3760 resistance zone.
Important Takeaways for GBP/USD and USD/CAD Analysis Today
· The British Pound started