


FXOpen

AUD/USD was rejected on a couple of occasions above the 0.6920, but it also remained well supported. NZD/USD is currently rising, but there is a major hurdle waiting near 0.6660.
Important Takeaways for AUD/USD and NZD/USD
- The Aussie Dollar formed a swing high near 0.6933 and declined to 0.6880 against the US Dollar.
- There is a major bullish trend line forming with support near 0.6890 on the hourly chart of AUD/USD.
- NZD/USD is currently rising towards the key 0.6660 and 0.6670 resistance levels.
- Earlier, there was a break above a key bearish trend line with resistance near 0.6630 on the hourly chart of NZD/USD.
AUD/USD Technical Analysis
In the past few days, there were a few attempts by the Aussie Dollar to gain strength above the 0.6920 resistance area against the US Dollar. However, the AUD/USD pair failed to continue higher and corrected lower from the 0.6933 high.
The pair declined below the 0.6900 support and the 50 hourly simple moving average. However, it found support near the 0.6880 area. A low was formed near 0.6883 and the pair is currently recovering higher.
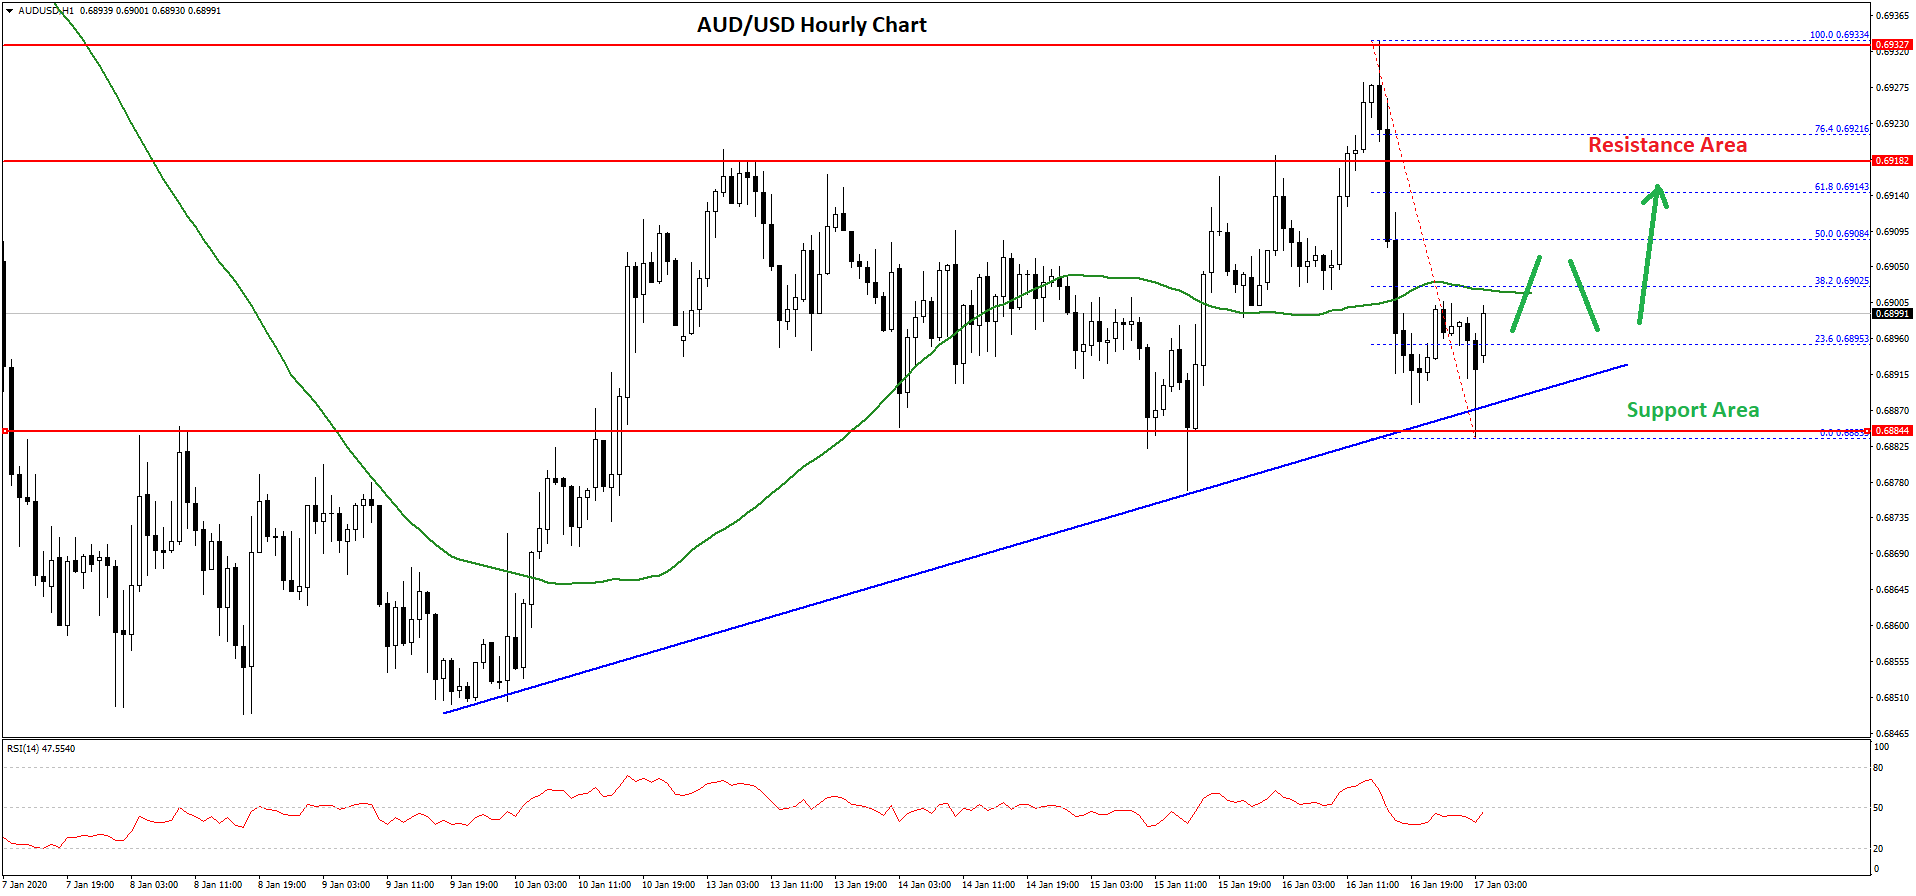
It broke the 23.6% Fib retracement level of the recent decline from the 0.6933 high to 0.6883 low. An immediate resistance is near the 0.6900 area and the 50 hourly simple moving average.
However, the first key resistance is near the 0.6910 level since it represents the 50% Fib retracement level of the recent decline from the 0.6933 high to 0.6883 low.
The main resistance on the upside is near the 0.6920 and 0.6930 levels. Therefore, a successful close above the 0.6930 level is needed for more gains. The next hurdle on the upside could be 0.6950, followed by 0.6980.
Conversely, the pair is likely to resume its decline. The main support on the downside is near the 0.6880 level, below which there is a risk of more losses towards 0.6850 or 0.6820 in the near term.
NZD/USD Technical Analysis
The New Zealand Dollar started a nice upward move from the 0.6580 support area against the US Dollar. The NZD/USD pair broke a few key resistances near 0.6600 and 0.6620 to move into a positive zone.
Moreover, the pair settled above the 0.6620 level and the 50 hourly simple moving average. More importantly, there was a break above a key bearish trend line with resistance near 0.6630 on the hourly chart of NZD/USD.
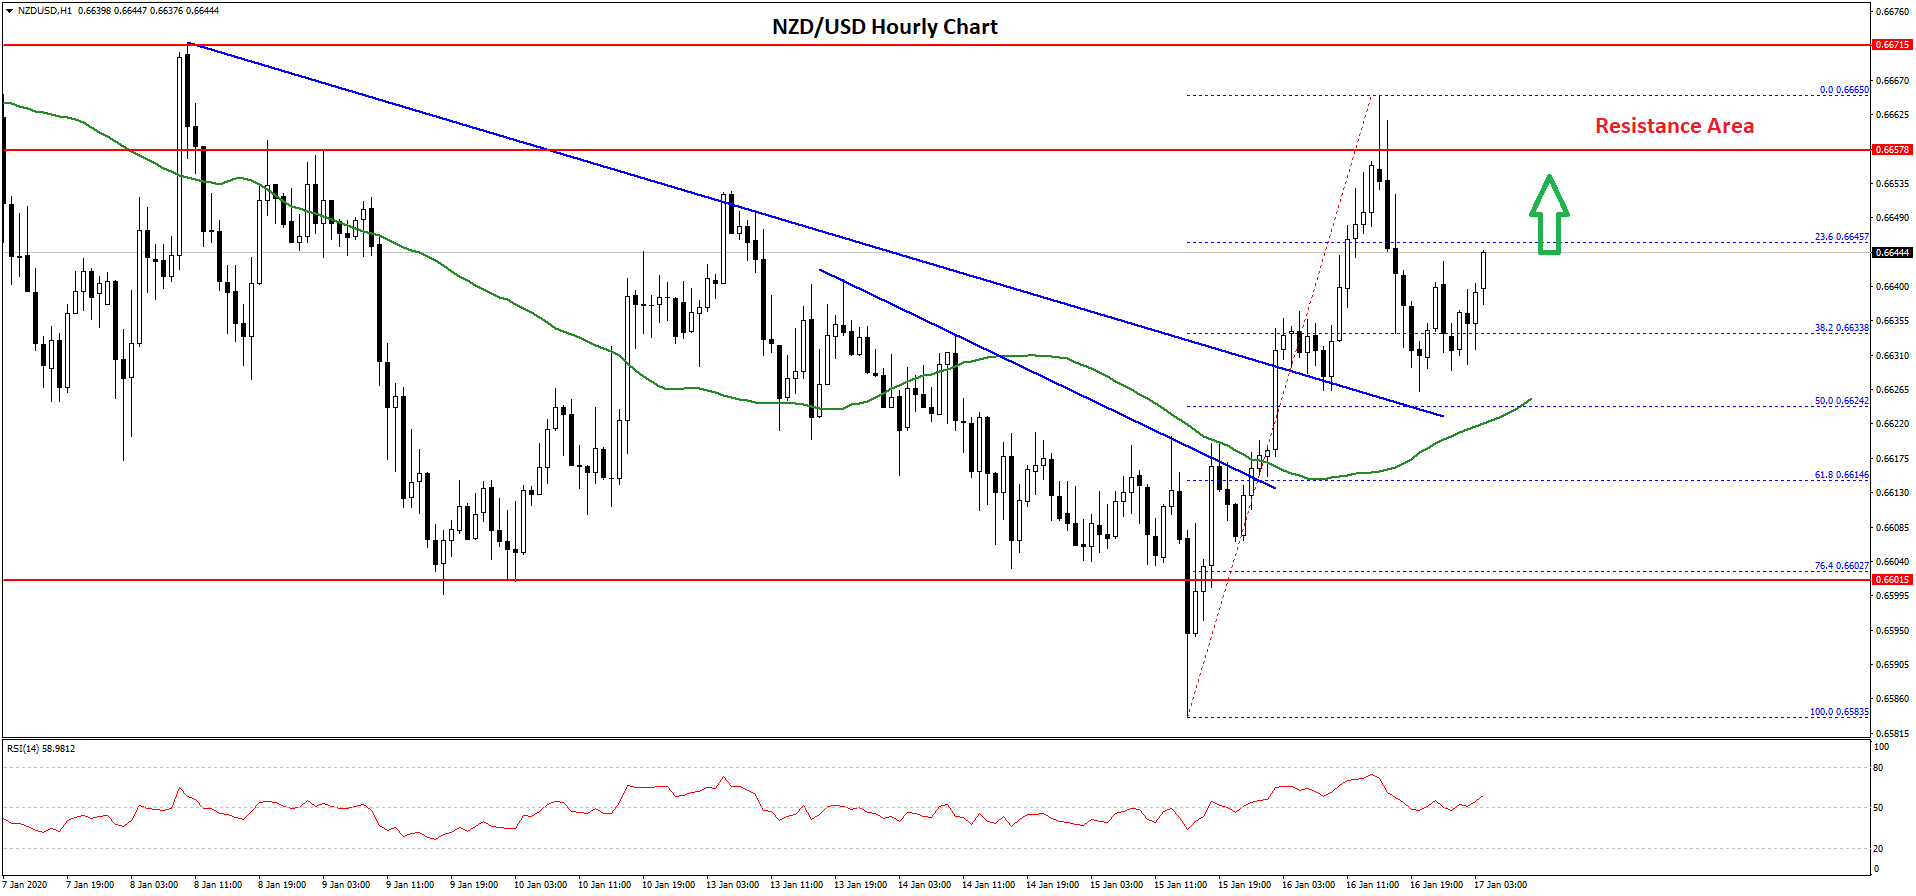
Finally, the pair spiked above the 0.6650 level and a high was formed near 0.6665. It corrected lower below the 23.6% Fib retracement level of the recent upward move from the 0.6583 low to 0.6665 high.
However, the decline was protected by the 0.6620 support area. Besides, the pair remained well above the 50 hourly SMA, plus the 50% Fib retracement level of the recent upward move from the 0.6583 low to 0.6665 high.
It is currently rising and gaining strength above the 0.6640 level. However, the bulls need to push the pair above the 0.6650 and 0.6660 resistance levels for a sustained upward move.
The next key resistance could be near the 0.6700 level. Conversely, the NZD/USD pair could decline below the 0.6620 support area and revisit the 0.6600 support in the near term.
Trade over 50 forex markets 24 hours a day with FXOpen. Take advantage of low commissions, deep liquidity, and spreads from 0.0 pips. Open your FXOpen account now or learn more about trading forex with FXOpen.
This article represents the opinion of the Companies operating under the FXOpen brand only. It is not to be construed as an offer, solicitation, or recommendation with respect to products and services provided by the Companies operating under the FXOpen brand, nor is it to be considered financial advice.
Latest from Forex Analysis
Latest articles

Anchored VWAP and How You Can Use It in Forex Trading
In the world of forex trading, understanding the nuanced tools at your disposal can significantly enhance decision-making processes. One such sophisticated tool is the Anchored Volume-Weighted Average Price (Anchored VWAP), which refines the standard VWAP by allowing traders to set

META Share Price Collapses after Publication of Quarterly Report
Just yesterday, META's stock price closed at USD 493.50, up approximately 40% since the start of 2024 and up nearly 300% since the start of 2023.
However, following the release of Meta's quarterly report, its shares plummeted to USD

USD/JPY Analysis: The Rate Exceeds The Level of 155 Yen Per US Dollar
Today, the price of USD/JPY once again renewed its 34-year high, exceeding the level of 155 yen per dollar, which put pressure on the current authorities.
According to Reuters, officials are trying to maintain calm in the market.
"We