


FXOpen

AUD/USD started a strong decline and traded below the key 0.6600 support area. Similarly, NZD/USD is declining heavily and it could continue to dive below the 0.6250 support.
Important Takeaways for AUD/USD and NZD/USD
- The Aussie Dollar started a major decline from well above 0.6650 against the US Dollar.
- There is a key bearish trend line forming with resistance near 0.6570 on the hourly chart of AUD/USD.
- NZD/USD is declining heavily and it broke a few key supports near 0.6300.
- There is a major bearish trend line forming with resistance near 0.6315 on the hourly chart of NZD/USD.
AUD/USD Technical Analysis
After forming a top near the 0.6700 area, the Aussie Dollar started a major decline below 0.6650 against the US Dollar. The AUD/USD pair even broke the 0.6600 support level to enter a bearish zone.
Moreover, there was a break below the 0.6560 support and the 50 hourly simple moving average. It opened the doors for more losses and the pair traded as low as 0.6527 on FXOpen.
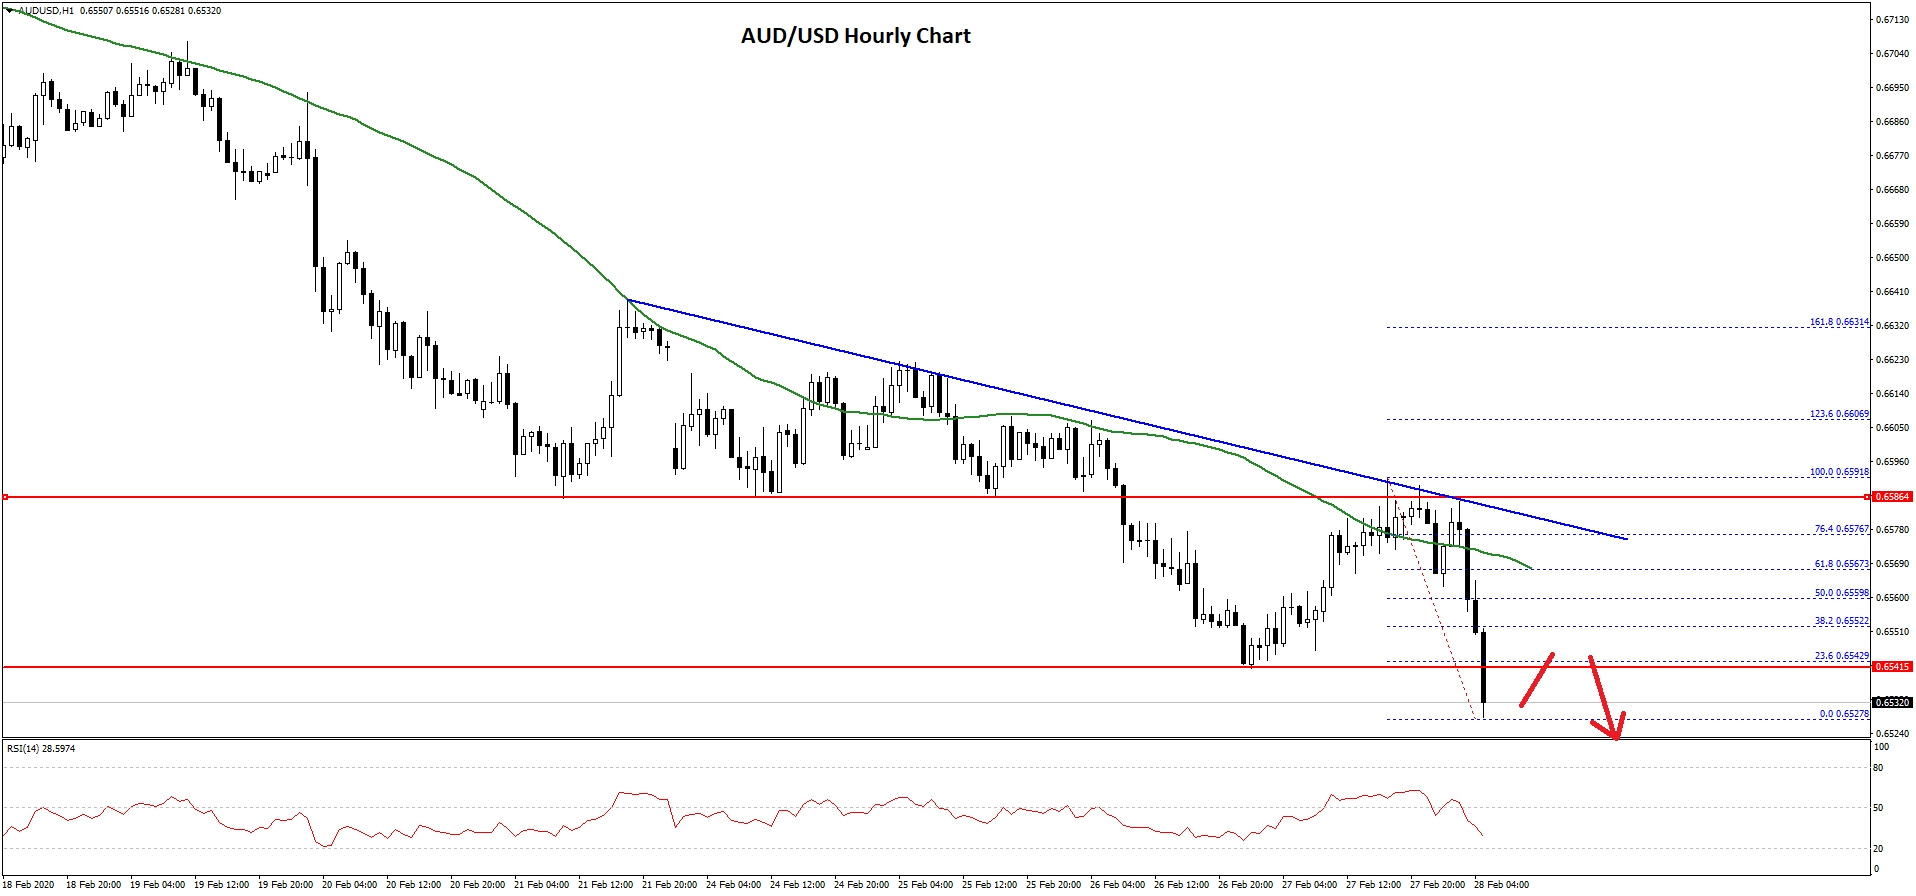
It is currently trading with a strong bearish angle below 0.6550. On the upside, an initial resistance is near the 0.6545 level. Besides, the 23.6% Fib retracement level of the recent decline from the 0.6591 high to 0.6527 low is also near 0.6545.
On the upside, there are a couple of key hurdles seen near the 0.6550 and 0.6555 levels. The 50% Fib retracement level of the recent decline from the 0.6591 high to 0.6527 low is also near 0.6555.
More importantly, is a key bearish trend line forming with resistance near 0.6570 on the hourly chart of AUD/USD. Therefore, it could be very tough for the bulls to start a decent recovery wave above the 0.6550 and 0.6570 levels.
If AUD/USD fails to recover above 0.6550 or 0.6570, there are chances of more downsides. An initial support is near the 0.6525 level, below which there is a risk of a sharp decline. The next major support is seen near the 0.6500 level.
NZD/USD Technical Analysis
The New Zealand Dollar also followed a similar pattern and declined below the key 0.6300 support area against the US Dollar. The NZD/USD even traded below the 0.6280 support level to enter further into a downtrend.
Finally, there was a close below 0.6270 and the pair settled well below the 50 hourly simple moving average. It traded as low as 0.6245 and it is currently following a bearish path.
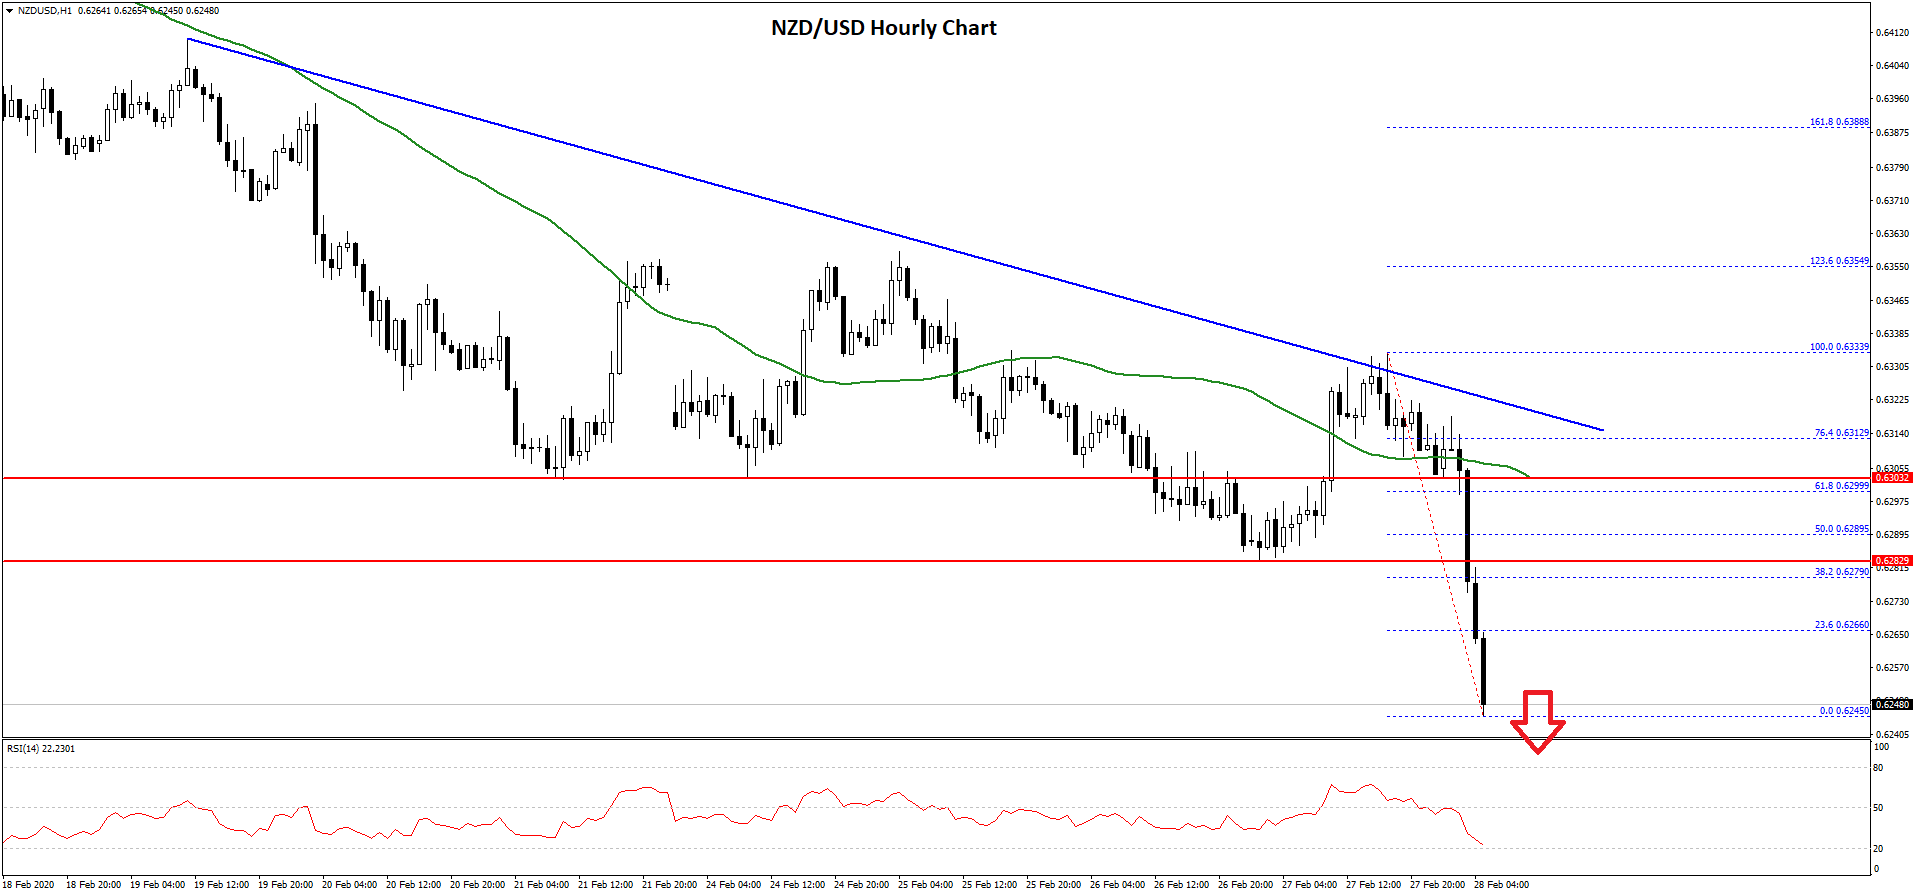
On the upside, an initial resistance is near the 0.6265 level. Besides, the 23.6% Fib retracement level of the recent slide from the 0.6333 high to 0.6245 low is also near 0.6265.
If there is a recovery wave above the 0.6265 and 0.6270, the pair could correct further higher. The next major resistance is near the 0.6290 level. The 50% Fib retracement level of the recent slide from the 0.6333 high to 0.6245 low is also near 0.6290.
Moreover, there is a major bearish trend line forming with resistance near 0.6315 on the hourly chart of NZD/USD. An intermediate resistance is near the 0.6300 level and the 50 hourly simple moving average.
Therefore, the pair must climb above 0.6300 and 0.6315 to start a decent recovery in the near term. Conversely, the NZD/USD pair could decline below the 0.6245 low. The next major support is near the 0.6200 area.
Trade over 50 forex markets 24 hours a day with FXOpen. Take advantage of low commissions, deep liquidity, and spreads from 0.0 pips. Open your FXOpen account now or learn more about trading forex with FXOpen.
This article represents the opinion of the Companies operating under the FXOpen brand only. It is not to be construed as an offer, solicitation, or recommendation with respect to products and services provided by the Companies operating under the FXOpen brand, nor is it to be considered financial advice.
Latest from Forex Analysis
Latest articles

Since the Start of the Week, Brent Oil Price Has Dropped over 4%
At the beginning of the week, March 15, we wrote that the price of Brent oil could form a correction from the resistance level of USD 91 per barrel. Since then, the price has decreased by more than 4% due

Fair Value Gaps vs Liquidity Voids in Trading
Understanding fair value gaps and liquidity voids is essential for traders seeking to navigate the complexities of the financial markets. These concepts, deeply rooted in the Smart Money Concept (SMC), provide valuable insights into the dynamics of supply and demand,

UK100 Share Index Rises as UK Inflation Slows
Yesterday, the UK Office for National Statistics (ONS) reported that the CPI stood at 3.2% in March. According to ForexFactory, analysts expected 3.1%, and a month ago the index was 3.4%.
Grant Fitzner, chief economist at the