


FXOpen
AUD/USD found support near 0.7200 after heavy declines. Similarly, NZD/USD found support near 0.6540, and both are currently correcting higher.
Important Takeaways for AUD/USD and NZD/USD
- The Aussie Dollar declined heavily before buyers appeared near 0.7200 against the US Dollar.
- There was a break above a connecting bearish trend line with resistance at 0.7235 on the hourly chart of AUD/USD.
- NZD/USD is recovering higher after finding a strong support near the 0.6540-50 zone.
- The New Zealand Producer Price Index in Q2 2018 (Input) rose 1% (QoQ), more than the last +0.6%.
AUD/USD Technical Analysis
The Aussie Dollar was under a lot of pressure from the 0.7455 swing high against the US Dollar. The AUD/USD pair dropped sharply and broke many supports near the 0.7400, 0.7350 and 0.7300 levels.
The pair also traded below the 0.7250 support and it almost tested the 0.7200 support. A new monthly low was formed at 0.7202 before the pair started an upward correction. It traded higher and broke the 0.7240 resistance plus the 50 hourly simple moving average.
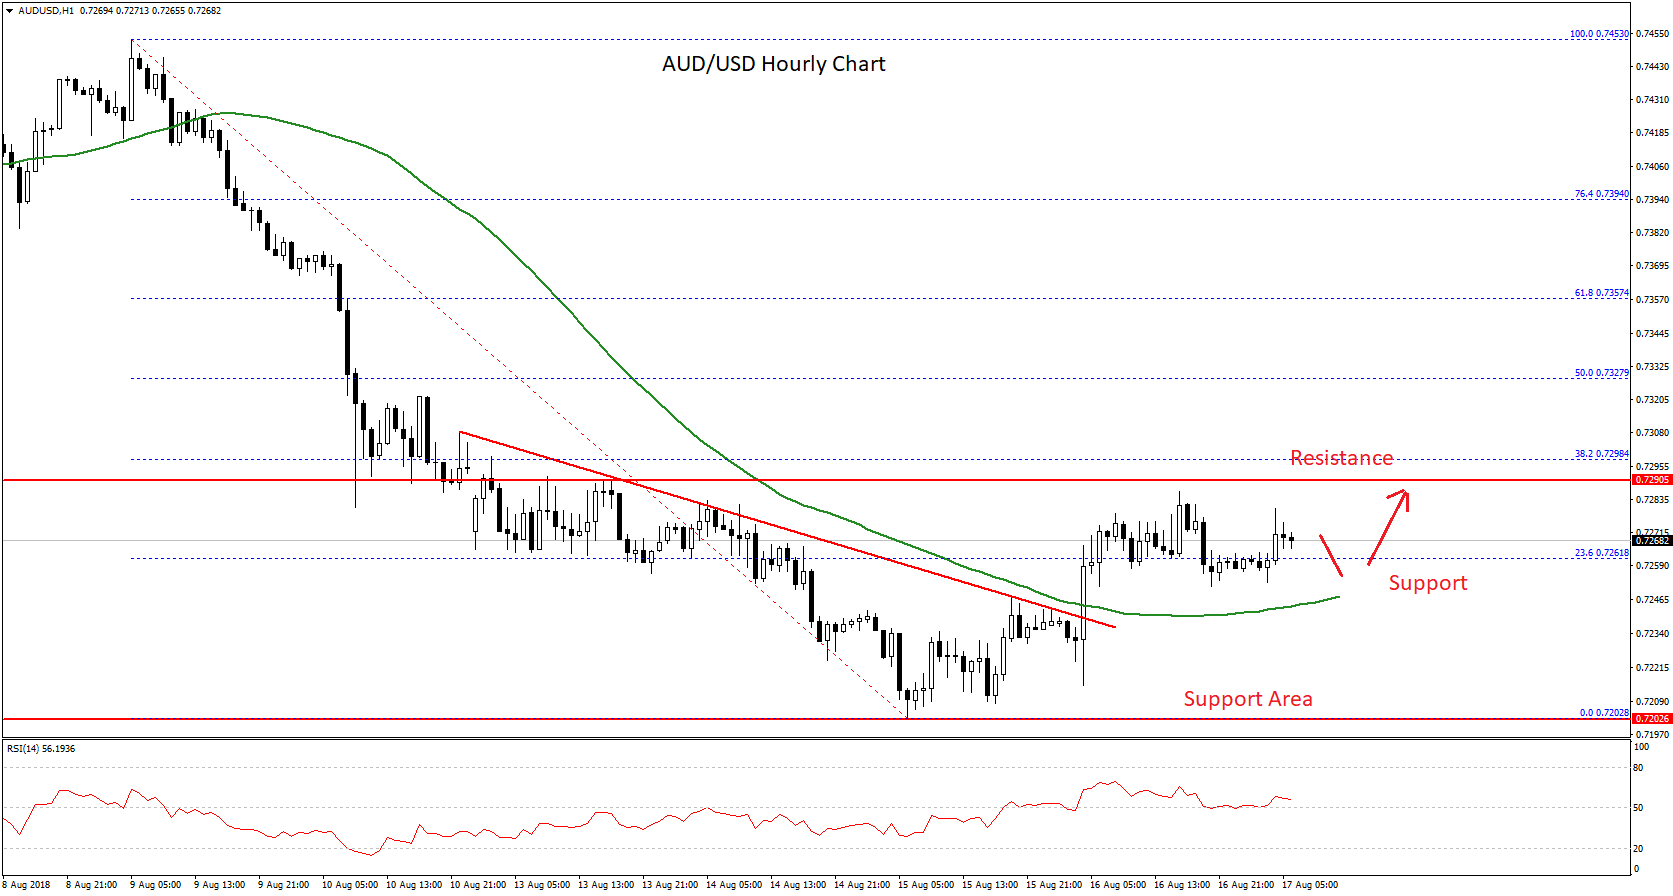
Moreover, there was a break above a connecting bearish trend line with resistance at 0.7235 on the hourly chart. The pair also moved above the 23.6% Fib retracement level of the last drop from the 0.7453 high to 0.7202 low.
On the upside, there is a strong resistance waiting near the 0.7290 and 0.7300 levels. Moreover, the 38.2% Fib retracement level of the last drop from the 0.7453 high to 0.7202 low is at 0.7298.
Therefore, if the pair continues to move higher, it won’t be easy for buyers to surpass the 0.7290 and 0.7300 resistance levels. Should they succeed, the pair will most likely gain momentum towards 0.7350 and 0.7365 in the near term.
On the downside, an initial support is near the 0.7250 level and the 50 hourly SMA. A break below the 0.7250 support may perhaps open the doors for a push back towards the 0.7200 support area.
NZD/USD Technical Analysis
The New Zealand Dollar also followed AUD/USD and declined heavily from the 0.6760 swing high against the US Dollar. The NZD/USD pair tumbled and cleared the 0.6700 and 0.6600 support levels.
The pair even spiked below the 0.6550 support area and formed a new monthly low at 0.6544. Later, the pair started a correction and moved above the 0.6570 resistance level. It tested the 0.6600 resistance level, which stopped the current recovery.
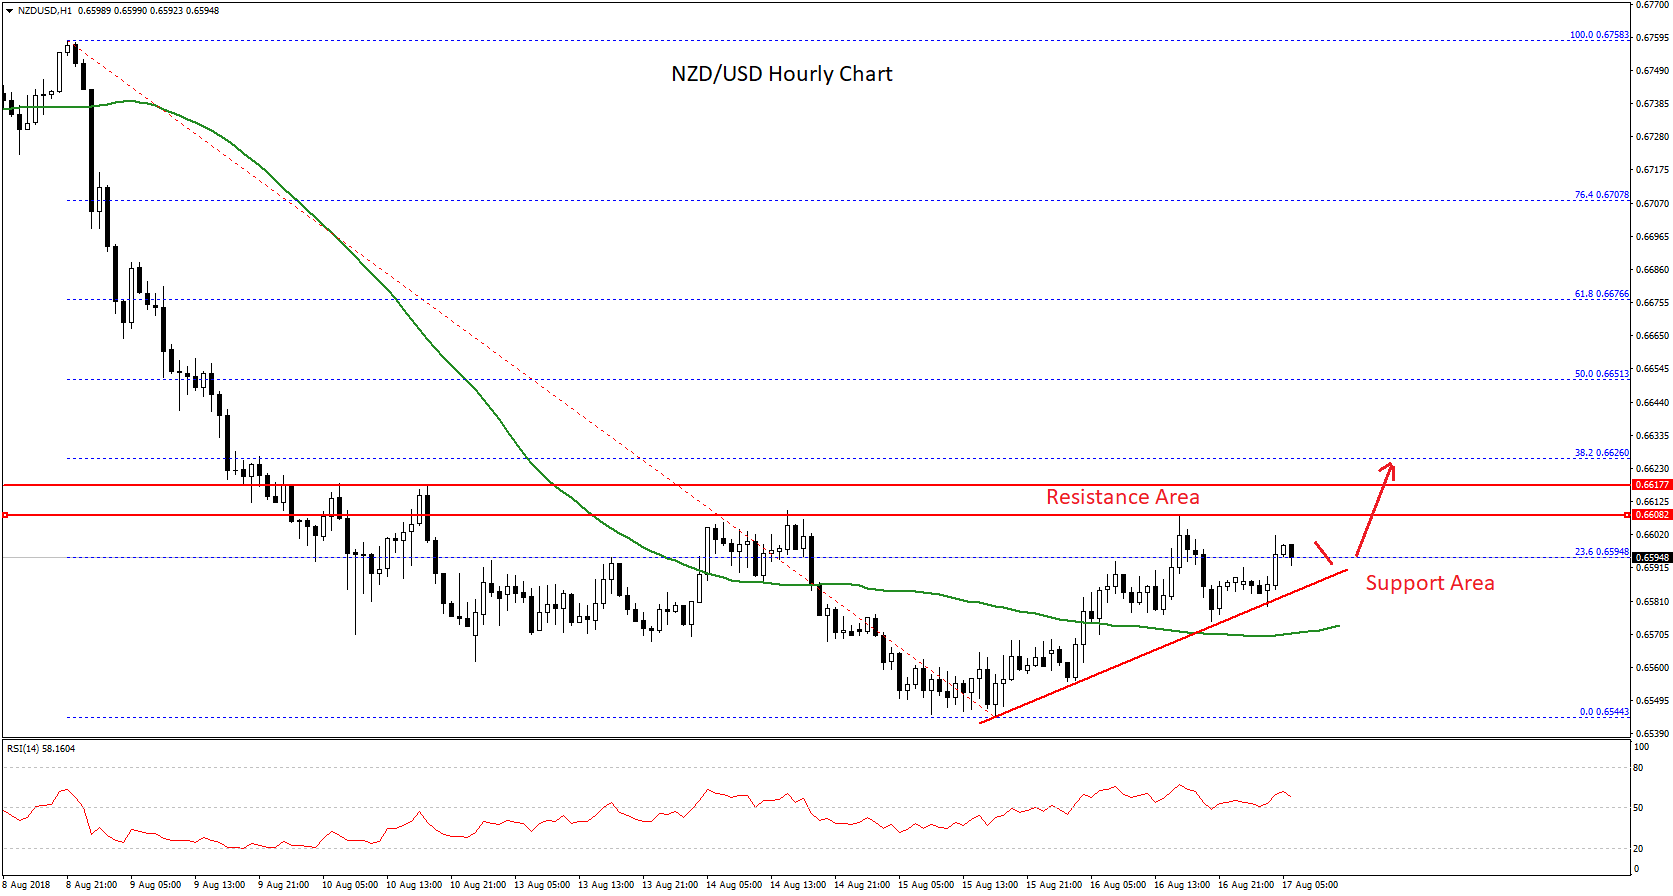
Moreover, the pair is struggling to settle above the 23.6% Fib retracement level of the last decline from the 0.6758 high to 0.6544 low. On the upside, there is a strong resistance near 0.6600-0.6620. A break above this is needed for buyers to take control for a recovery towards the 0.6650 level.
The 0.6650 level is the next major resistance since it is the 50% Fib retracement level of the last decline from the 0.6758 high to 0.6544 low. On the flip side, if the pair declines from the current levels, it could find support near a bullish trend line on the hourly chart at 0.6585.
Below the trend line, the next support is near 0.6570 and the 50 hourly SMA. Finally, the last low near 0.6540-50 is the most important support.
Fundamentally, the New Zealand Producer Price Index (Input) for Q2 2018 was released. The market was looking for a rise of around 0.8% (QoQ). However, the result was above the forecast as the PPI Input came in at 1%, up from the last 0.6%.
Trade over 50 forex markets 24 hours a day with FXOpen. Take advantage of low commissions, deep liquidity, and spreads from 0.0 pips. Open your FXOpen account now or learn more about trading forex with FXOpen.
This article represents the opinion of the Companies operating under the FXOpen brand only. It is not to be construed as an offer, solicitation, or recommendation with respect to products and services provided by the Companies operating under the FXOpen brand, nor is it to be considered financial advice.
Latest from Forex Analysis
Latest articles

Google Share Price Rose Post-market to a New All-time Record
Yesterday, after the close of the main trading session, a report on activities for the 1st quarter of Alphabet Inc. (Google's parent company) was published. The report was strong, exceeding investors' expectations.
→ Quarterly EPS = USD 1.89 (expected = USD 1.

S&P 500 Rebounds after Negative GDP News
Data released yesterday showed US GDP growth slowed to 1.6% in the first quarter of the year. According to ForexFactory: forecast = 2.2%, past value = 2.4%.
Reaction to the news sent the S&P 500 mini stock

GBP/USD And USD/CAD Daily Chart Outlook
GBP/USD is attempting a recovery wave from 1.2300. USD/CAD is consolidating and might aim for a move above the 1.3760 resistance zone.
Important Takeaways for GBP/USD and USD/CAD Analysis Today
· The British Pound started