


FXOpen

AUD/USD started a fresh decline from well above the 0.7550 level. NZD/USD also declined heavily and it even tested the 0.6920 support zone.
Important Takeaways for AUD/USD and NZD/USD
- The Aussie Dollar started a major decline after it failed to clear 0.7600 against the US Dollar.
- There is a key bearish trend line forming with resistance near 0.7435 on the hourly chart of AUD/USD.
- NZD/USD also started a major decline from well above the 0.7050 level.
- There is a major bearish trend line forming with resistance near 0.6975 on the hourly chart of NZD/USD.
AUD/USD Technical Analysis
After struggling to clear the 0.7600 resistance, the Aussie Dollar started a major decline against the US Dollar. The AUD/USD pair broke the 0.7550 and 0.7520 support levels to move into a bearish zone.
The pair even broke the 0.7480 support and the 50 hourly simple moving average. It spiked below 0.7420 and traded as low as 0.7409 on FXOpen. It is now consolidating losses above the 0.7400 level.
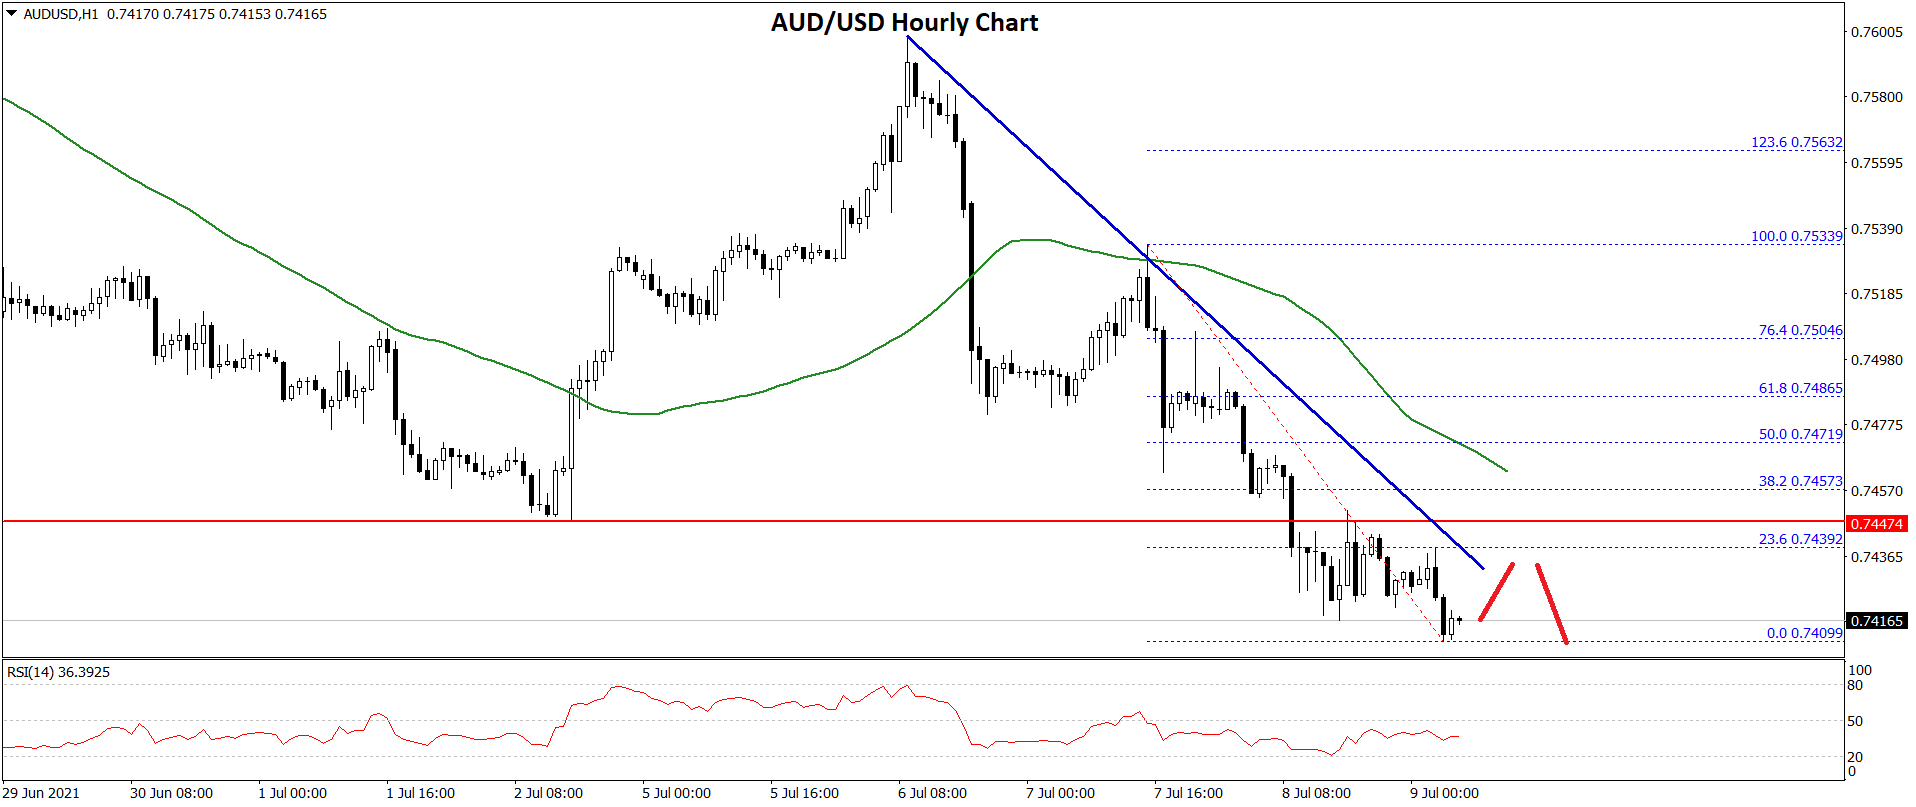
An immediate resistance is near the 0.7430 level. It is near the 23.6% Fib retracement level of the recent decline from the 0.7533 swing high to 0.7409 low. There is also a key bearish trend line forming with resistance near 0.7435 on the hourly chart of AUD/USD.
The next major resistance is near the 0.7465 level and the 50 hourly SMA. The 50% Fib retracement level of the recent decline from the 0.7533 swing high to 0.7409 low is also near the 0.7470 level.
To move into a positive zone, the pair must settle above 0.7470 and the 50 hourly SMA. An initial support on the downside is near the 0.7410 level. The next major support is near the 0.7400 level. If there is a downside break below the 0.7400 support, the pair could extend its decline towards the 0.7350 level.
NZD/USD Technical Analysis
The New Zealand Dollar also followed a similar path after it topped near the 0.7100 level against the US Dollar. The NZD/USD pair broke the main 0.7000 support zone to move into a bearish zone.
There was a also a break below the 0.6950 level and the 50 hourly simple moving average. It spiked below 0.6940 and traded as low as 0.6923. It is now consolidating losses above the 0.6930 level.
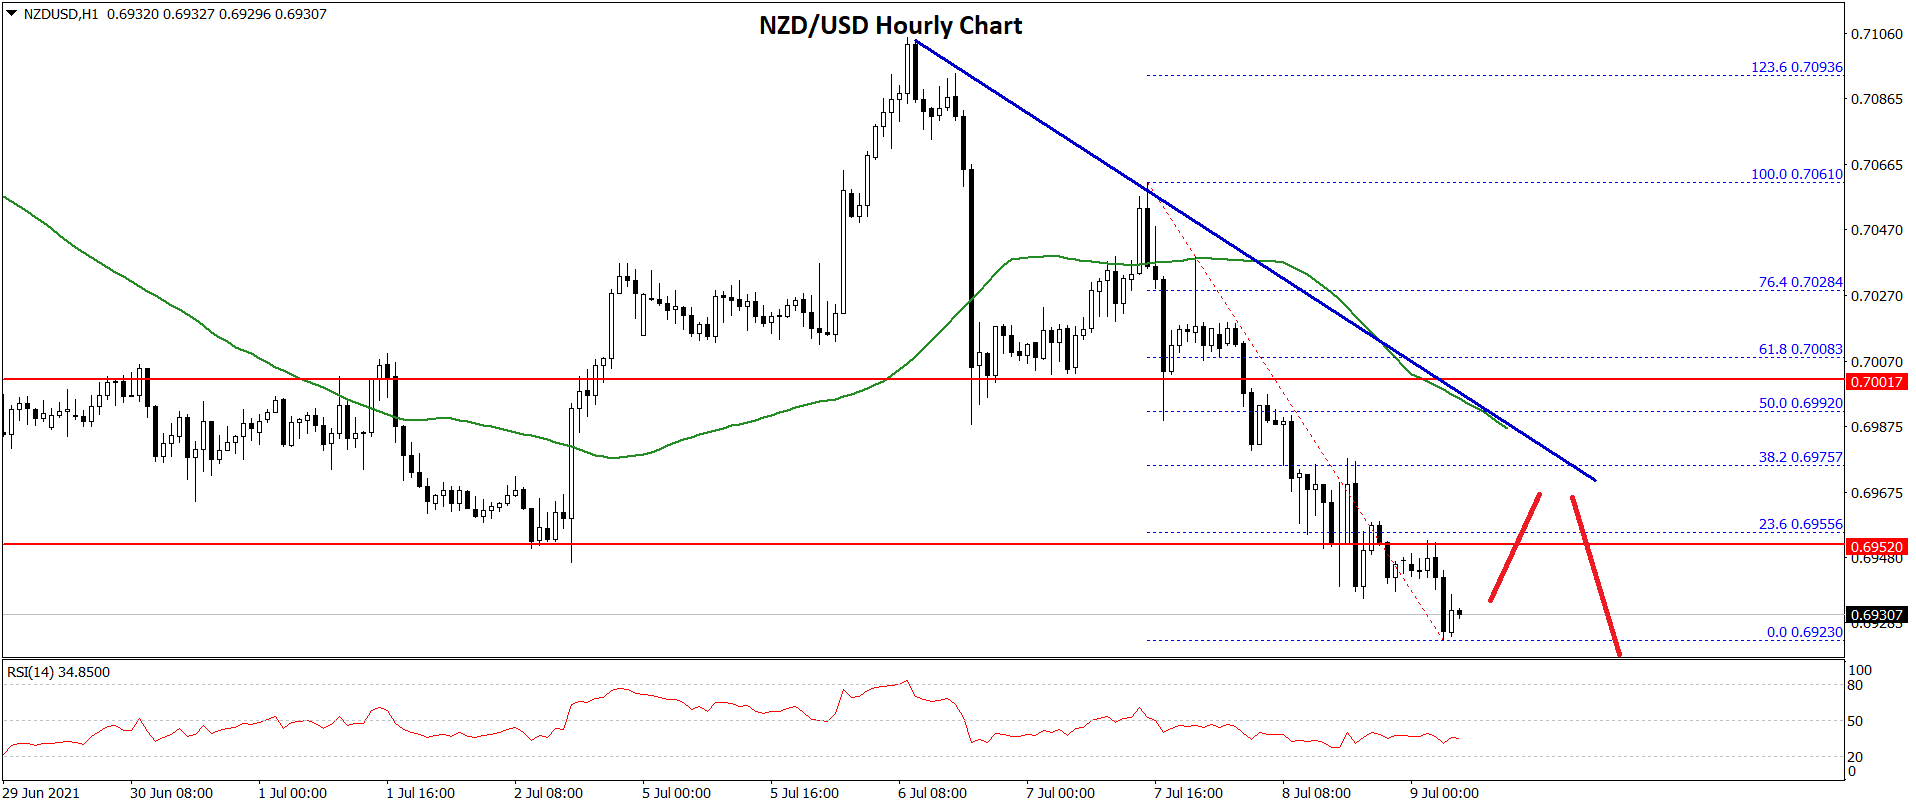
An immediate resistance is near the 0.6955 level. It is near the 23.6% Fib retracement level of the recent drop from the 0.7061 swing high to 0.6923 low. There is also a major bearish trend line forming with resistance near 0.6975 on the hourly chart of NZD/USD.
The next major resistance is near the 0.6990 level and the 50 hourly SMA. The 50% Fib retracement level of the recent drop from the 0.7061 swing high to 0.6923 low is also near the 0.6990 level.
To move into a positive zone, the pair must settle above 0.7000 and the 50 hourly SMA. An initial support on the downside is near the 0.6925 level. The next major support is near the 0.6900 level.
If there is a downside break below the 0.6900 support, the NZD/USD pair could extend its decline towards the 0.6865 level.
This forecast represents FXOpen Markets Limited opinion only, it should not be construed as an offer, invitation or recommendation in respect to FXOpen Markets Limited products and services or as financial advice.
Trade over 50 forex markets 24 hours a day with FXOpen. Take advantage of low commissions, deep liquidity, and spreads from 0.0 pips. Open your FXOpen account now or learn more about trading forex with FXOpen.
This article represents the opinion of the Companies operating under the FXOpen brand only. It is not to be construed as an offer, solicitation, or recommendation with respect to products and services provided by the Companies operating under the FXOpen brand, nor is it to be considered financial advice.
Latest from Forex Analysis
Latest articles

Anchored VWAP and How You Can Use It in Forex Trading
In the world of forex trading, understanding the nuanced tools at your disposal can significantly enhance decision-making processes. One such sophisticated tool is the Anchored Volume-Weighted Average Price (Anchored VWAP), which refines the standard VWAP by allowing traders to set

META Share Price Collapses after Publication of Quarterly Report
Just yesterday, META's stock price closed at USD 493.50, up approximately 40% since the start of 2024 and up nearly 300% since the start of 2023.
However, following the release of Meta's quarterly report, its shares plummeted to USD

USD/JPY Analysis: The Rate Exceeds The Level of 155 Yen Per US Dollar
Today, the price of USD/JPY once again renewed its 34-year high, exceeding the level of 155 yen per dollar, which put pressure on the current authorities.
According to Reuters, officials are trying to maintain calm in the market.
"We