


FXOpen

AUD/USD started a strong recovery and traded above the 0.6950 resistance area. Similarly, there were strong gains in NZD/USD above the 0.6650 and 0.6680 resistance levels.
Important Takeaways for AUD/USD and NZD/USD
- The Aussie Dollar regained traction and climbed higher from the 0.6880 support against the US Dollar.
- There is a crucial bullish trend line forming with support near the 0.6990 level on the hourly chart of AUD/USD.
- NZD/USD also followed a bullish path and traded above the 0.6650 resistance level.
- It is also following a major bullish trend line with support near 0.6688 on the hourly chart.
AUD/USD Technical Analysis
The Aussie Dollar started a strong upward move above the 0.6900 pivot level against the US Dollar. The AUD/USD pair broke the key 0.6910 and 0.6950 resistance levels to move into a bullish zone.
The pair even gained traction above the0.6980 level and settled well above the 50 hourly simple moving average. Finally, it surpassed the 0.7000 handle and recently traded to a new weekly high at 0.7009 on FXOpen.
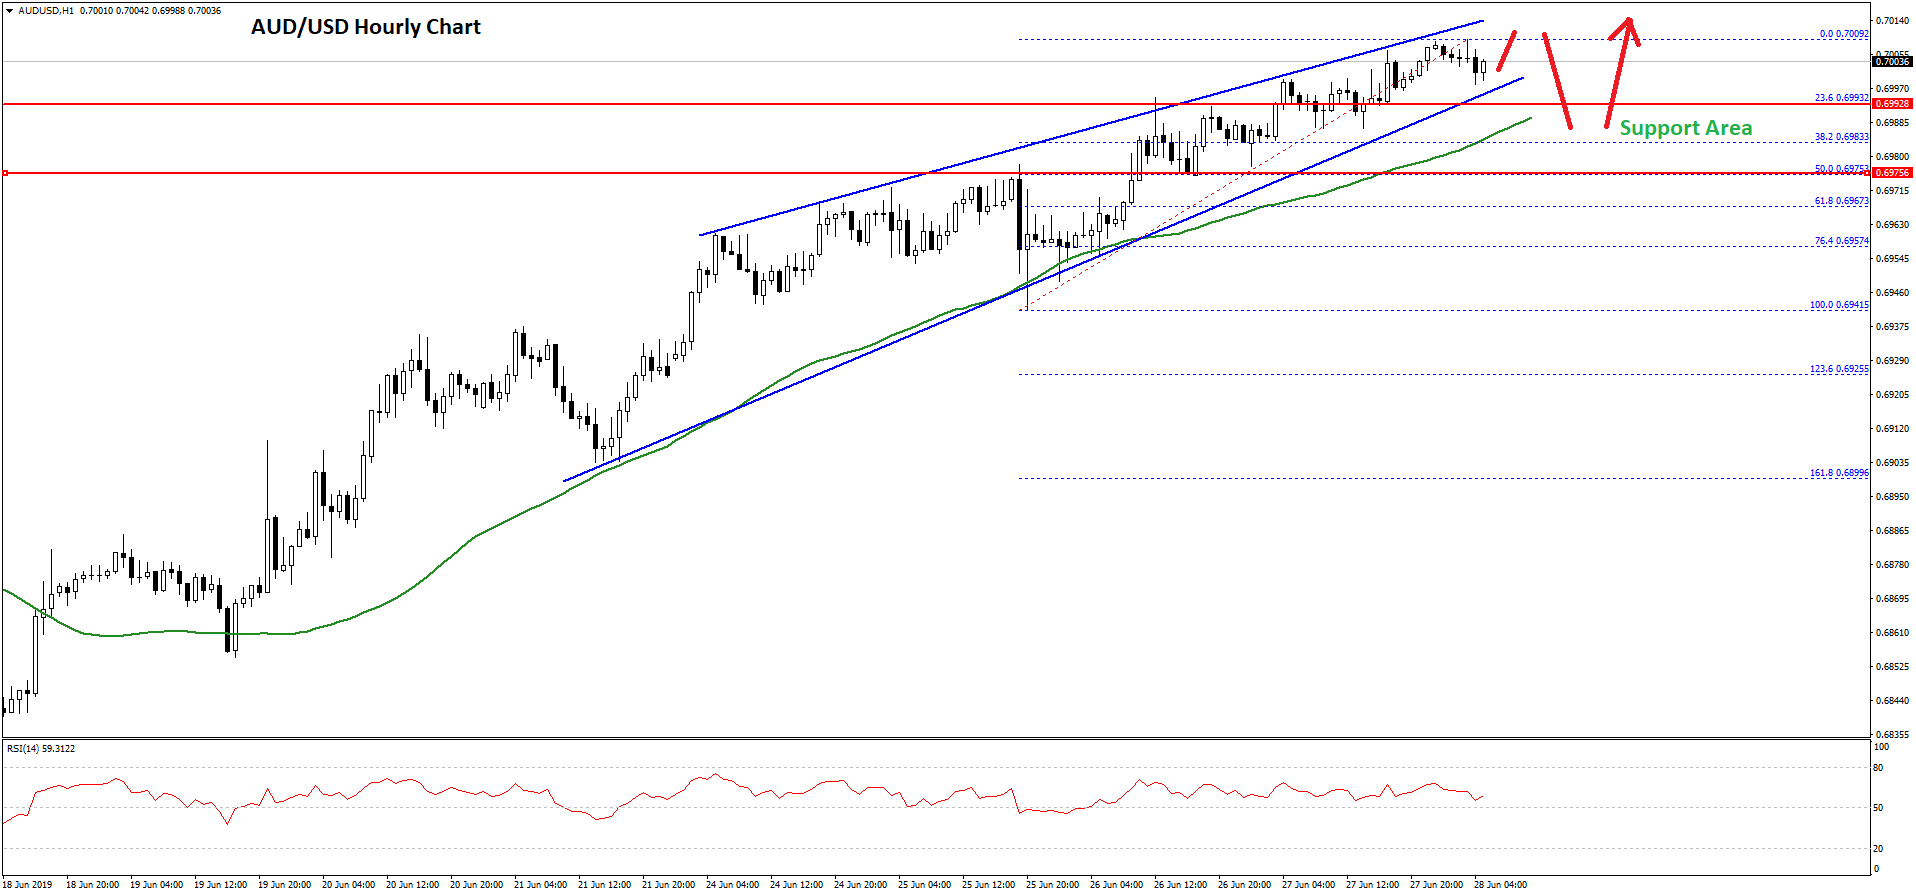
It is currently trading in a strong uptrend above 0.6980 and 0.6990 supports. There is also a crucial bullish trend line forming with support near the 0.6990 level on the hourly chart of AUD/USD.
The 23.6% Fib retracement level of the last wave from the 0.6941 low to 0.7009 high is also near the 0.6993 level to act as a support.
Therefore, if there is a downside correction, AUD/USD is likely to find a strong support near the 0.6990 level. The next key support is near the 0.6975 level and the 50% Fib retracement level of the last wave from the 0.6941 low to 0.7009 high.
An intermediate support is near 0.6980 and the 50 hourly simple moving average. Therefore, as long as the pair is above the 0.6975 level, it is likely to continue higher.
On the upside, an immediate resistance is near the 0.7010 level. If there is an upside break above 0.7010, the price could continue to rise towards the 0.7040 level in the near term.
NZD/USD Technical Analysis
The New Zealand Dollar also started a strong recovery from the 0.6550 support area against the US Dollar. The NZD/USD pair broke the 0.6600 and 0.6620 resistance levels to move into a positive zone.
The upward move gathered pace above the 0.6650 level and the 50 hourly simple moving average. The pair even climbed above the 0.6680 level and recently spiked above 0.6700.
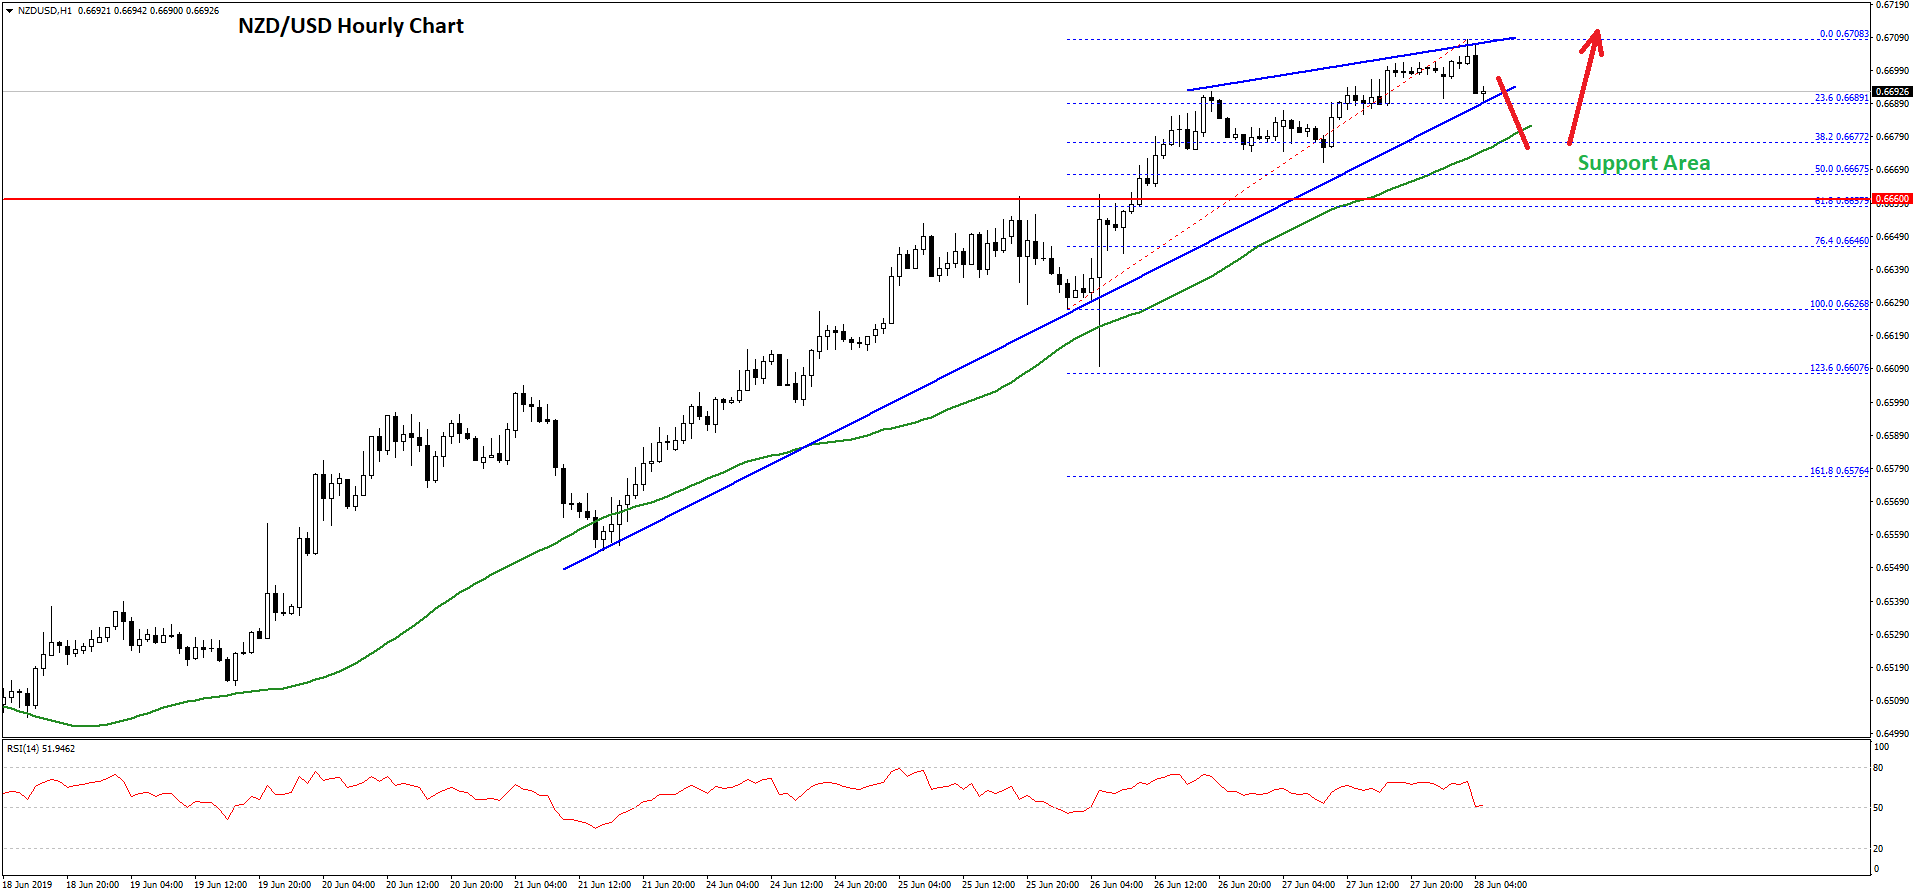
A swing high was formed at 0.6708 and the pair is currently correcting lower. It is testing the 0.6690 support and the 23.6% Fib retracement level of the last wave from the 0.6626 low to 0.6708 high.
Moreover, the pair is also holding a major bullish trend line with support near 0.6688 on the hourly chart. If there is a downside break, the pair could test the 0.6680 support and the 50 hourly SMA.
The next key support is near the 0.6660 level or the 50% Fib retracement level of the last wave from the 0.6626 low to 0.6708 high. As long as the pair is trading above the 0.6660 and 0.6650 pivot levels, there could be more gains.
On the upside, an immediate resistance is near the 0.6710 level, above which NZD/USD could rise towards the 0.6730 or 0.6745 level.
Trade over 50 forex markets 24 hours a day with FXOpen. Take advantage of low commissions, deep liquidity, and spreads from 0.0 pips. Open your FXOpen account now or learn more about trading forex with FXOpen.
This article represents the opinion of the Companies operating under the FXOpen brand only. It is not to be construed as an offer, solicitation, or recommendation with respect to products and services provided by the Companies operating under the FXOpen brand, nor is it to be considered financial advice.
Latest from Forex Analysis
Latest articles

Anchored VWAP and How You Can Use It in Forex Trading
In the world of forex trading, understanding the nuanced tools at your disposal can significantly enhance decision-making processes. One such sophisticated tool is the Anchored Volume-Weighted Average Price (Anchored VWAP), which refines the standard VWAP by allowing traders to set

META Share Price Collapses after Publication of Quarterly Report
Just yesterday, META's stock price closed at USD 493.50, up approximately 40% since the start of 2024 and up nearly 300% since the start of 2023.
However, following the release of Meta's quarterly report, its shares plummeted to USD

USD/JPY Analysis: The Rate Exceeds The Level of 155 Yen Per US Dollar
Today, the price of USD/JPY once again renewed its 34-year high, exceeding the level of 155 yen per dollar, which put pressure on the current authorities.
According to Reuters, officials are trying to maintain calm in the market.
"We