


FXOpen

AUD/USD is following a positive zone and it recently broke the 0.7620 resistance. NZD/USD is also trading in a positive zone above the 0.7030 support.
Important Takeaways for AUD/USD and NZD/USD
- The Aussie Dollar started a fresh increase above the 0.7580 and 0.7600 levels against the US Dollar.
- There is a key bullish trend line forming with support near 0.7630 on the hourly chart of AUD/USD.
- NZD/USD traded as high as 0.7065 and it is currently correcting lower.
- There is a major bullish trend line forming with support near 0.7025 on the hourly chart of NZD/USD.
AUD/USD Technical Analysis
After testing the 0.7550 support zone, the Aussie Dollar started a fresh increase against the US Dollar. The AUD/USD pair broke a few key hurdles near the 0.7580 level to move into a positive zone.
The pair even broke the 0.7600 level and the 50 hourly simple moving average. It traded as high as 0.7676 on FXOpen and recently corrected lower. The recent swing high was formed near 0.7660 and the pair is now trading below the 0.7650 level.
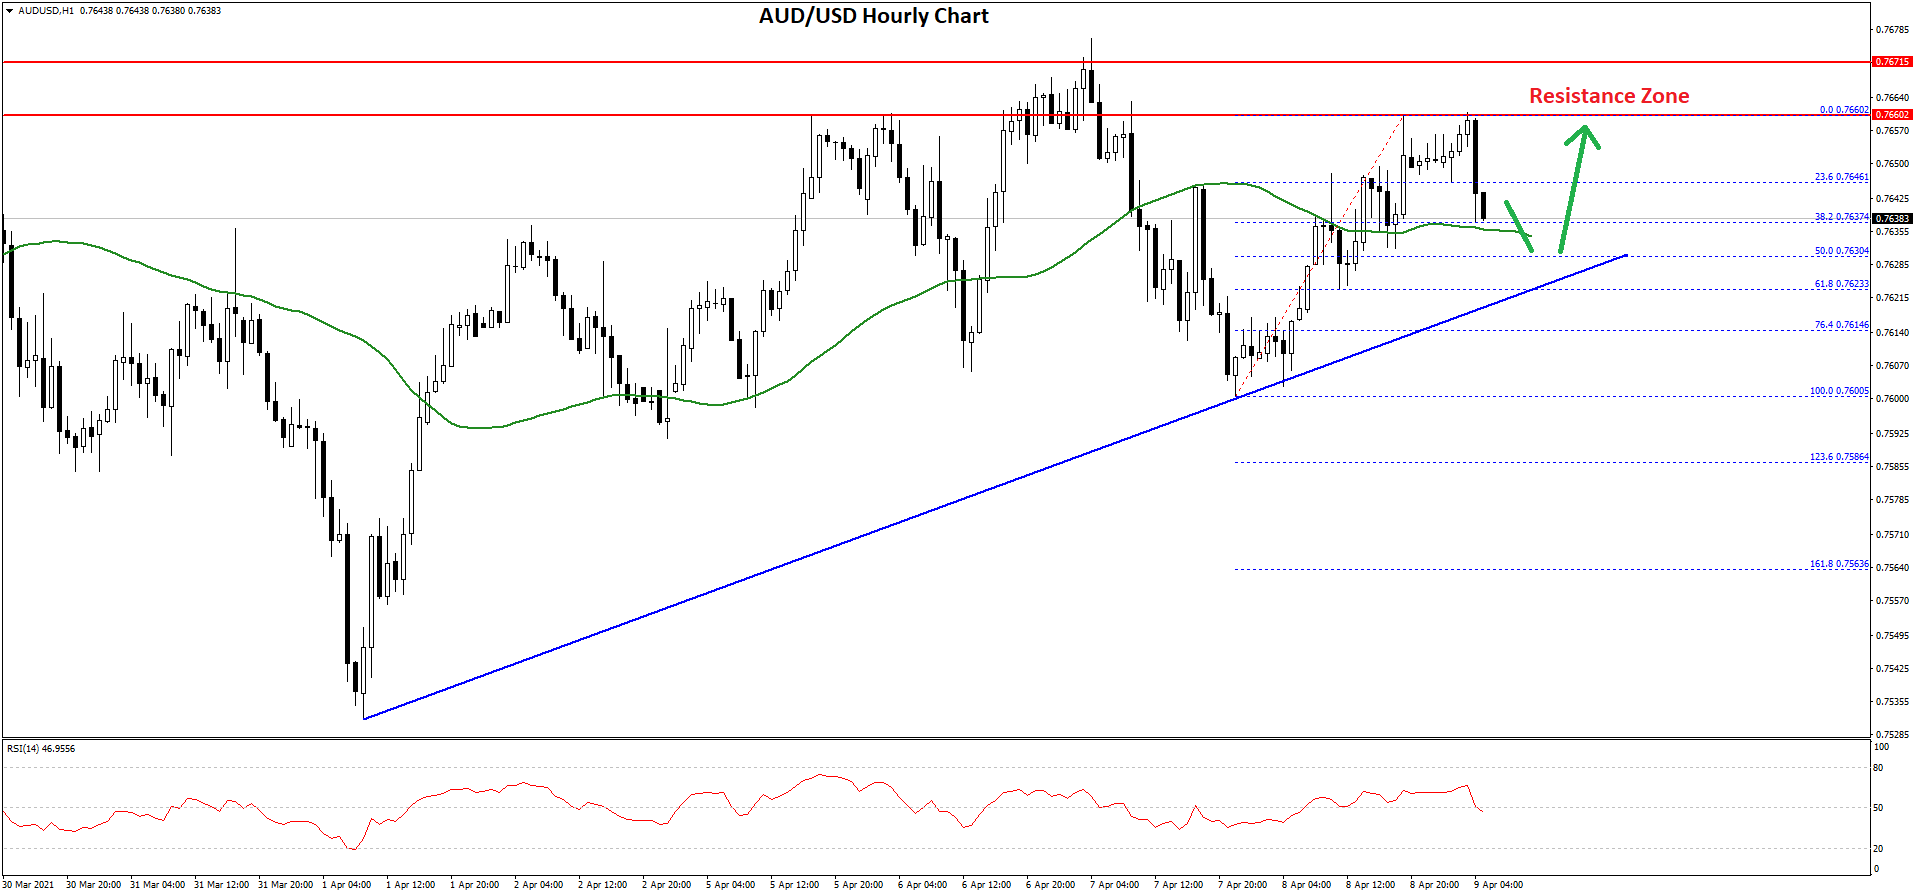
It broke the 23.6% Fib retracement level of the upward move from the 0.7600 swing low to 0.7660 swing high. It is now testing the 0.7635 support level and the 50 hourly simple moving average.
There is also a key bullish trend line forming with support near 0.7630 on the hourly chart of AUD/USD. The trend line is close to the 50% Fib retracement level of the upward move from the 0.7600 swing low to 0.7660 swing high.
If there is a downside break below the trend line, the pair could dive towards the 0.7600 support zone in the near term. On the upside, the pair is facing hurdles near the 0.7650 and 0.7660 levels.
The main resistance is near the 0.7675 level. A successful close above the 0.7660 and 0.7675 levels could open the doors for a steady increase in the coming sessions. The next key resistance could be 0.7720.
NZD/USD Technical Analysis
The New Zealand Dollar also followed a similar path and started a decent increase above the 0.6980 resistance against the US Dollar. The NZD/USD pair even cleared the 0.7000 resistance to move into a positive zone.
The pair climbed higher towards the 0.7060 level and settled above the 50 hourly simple moving average. A high is formed near 0.765 and the pair is currently correcting lower.
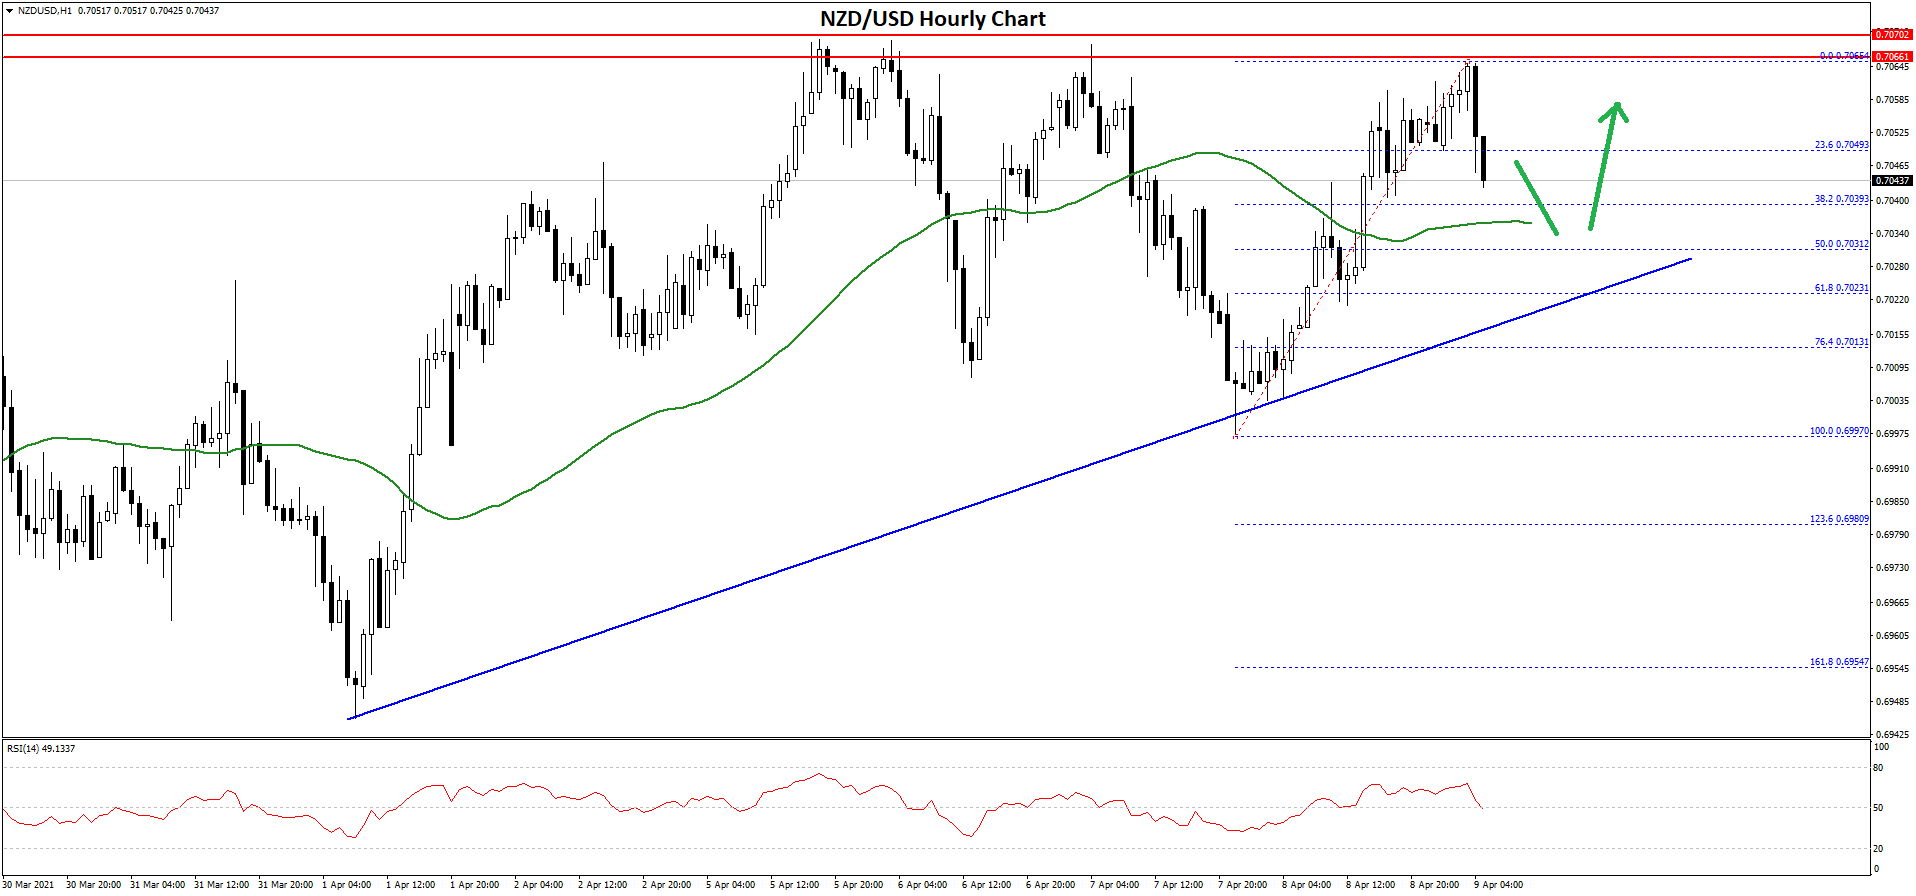
It traded below the 23.6% Fib retracement level of the upward move from the 0.6997 swing low to 0.7066 swing high. On the downside, the first key support is near the 0.7030 and 0.7025 levels.
There is also a major bullish trend line forming with support near 0.7025 on the hourly chart of NZD/USD. The trend line coincides with the 50% Fib retracement level of the upward move from the 0.6997 swing low to 0.7066 swing high.
If there is a downside break below the trend line, the pair could decline towards the 0.7000 support. Any more losses may possibly call for a test of 0.6980.
Conversely, the pair could start a fresh increase above 0.7055. The main resistance is near the 0.7065 zone. A clear break and close above the 0.7065 level could push NZD/USD towards the 0.7100 level.
Trade over 50 forex markets 24 hours a day with FXOpen. Take advantage of low commissions, deep liquidity, and spreads from 0.0 pips. Open your FXOpen account now or learn more about trading forex with FXOpen.
This article represents the opinion of the Companies operating under the FXOpen brand only. It is not to be construed as an offer, solicitation, or recommendation with respect to products and services provided by the Companies operating under the FXOpen brand, nor is it to be considered financial advice.
Latest from Forex Analysis
Latest articles

Is There the Best Time to Trade Stock CFDs?
If you ask experienced traders, many will say that they trade on certain days or at certain times of the day. Their choice is determined by the market dynamics, volatility, and liquidity. It’s crucial to understand when the best

UnitedHealth (UNH) Share Price Surges after Strong Report
UnitedHealth shares surged Tuesday, rising more than 5% after the health care giant delivered stronger-than-expected first-quarter 2024 results:
→ earnings per share: actual = USD 6.91, expected = USD 6.61, last quarter = USD 6.16;
→ gross income: actual = USD 94.4

USD/JPY Analysis: Prospect of a Breakout of the Level of 155 Yen per Dollar
The USD/JPY rate has consistently reached new highs since 1990, approaching the psychological level of 155 yen per US dollar. The Japanese currency has already fallen about 9% against the dollar this year.
This is supported by Jerome Powell,