


FXOpen

AUD/USD extended its rise above 0.7500 and traded to a new multi-month high above 0.7600. NZD/USD also followed a similar path and climbed towards the 0.7200 zone.
Important Takeaways for AUD/USD and NZD/USD
- The Aussie Dollar gained pace above the 0.7500 and 0.7550 resistance levels against the US Dollar.
- There is a major contracting triangle forming with resistance near 0.7620 on the hourly chart of AUD/USD.
- NZD/USD climbed higher nicely and surpassed the 0.7150 resistance level.
- A key bullish trend line is forming with support near 0.7100 on the hourly chart of NZD/USD.
AUD/USD Technical Analysis
In the past few weeks, the Aussie Dollar followed a bullish path after a proper close above 0.7350 against the US Dollar. The AUD/USD pair even broke the 0.7500 resistance level to move into a positive zone.
The upward move gained pace above the 0.7550r resistance and the pair settled well above the 50 hourly simple moving average. The pair even spiked above the 0.7600 level and it traded to a new multi-month high at 0.7639.
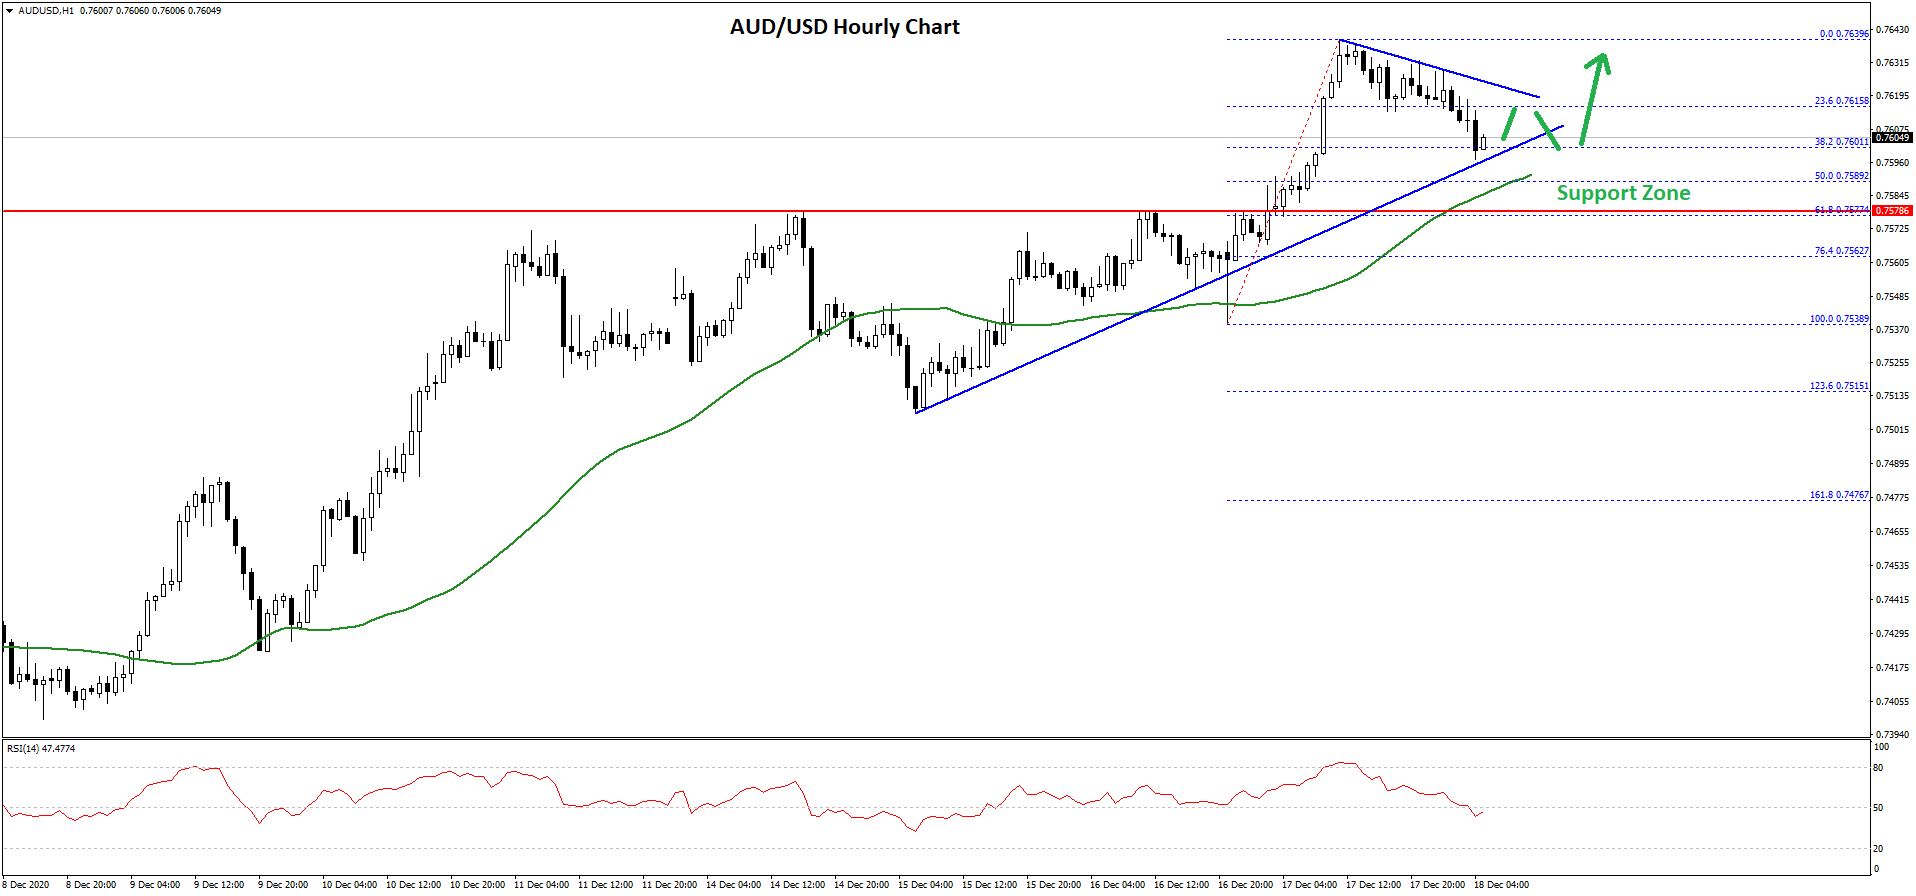
Recently, there was a minor downside correction below the 0.7620 level. The pair traded below the 23.6% Fib retracement level of the recent increase from the 0.7538 swing low to 0.7639 high.
The pair is now testing the 0.7600 support level. There is also a major contracting triangle forming with resistance near 0.7620 on the hourly chart of AUD/USD. The triangle support is near the 0.7600 zone and acting as a strong support.
The next major support is near the 0.7590 level and the 50 hourly simple moving average. The 50% Fib retracement level of the recent increase from the 0.7538 swing low to 0.7639 high is also near the 0.7590 level to provide support.
If there are more losses and a downside break below 0.7575-0.7580, the pair could extend losses towards the 0.7550 support. Conversely, the pair could start a fresh increase above the 0.7620 resistance zone.
The first major resistance is near the 0.7640 level, above which AUD/USD could accelerate higher towards the 0.7680 level.
NZD/USD Technical Analysis
The New Zealand Dollar also followed a bullish path above the 0.7000 pivot level against the US Dollar. The NZD/USD pair even surged above the 0.7100 resistance zone.
The pair climbed above the 0.7150 level and settled well above the 50 hourly simple moving average. It traded to a new multi-month high at 0.7170 before starting a downside correction.
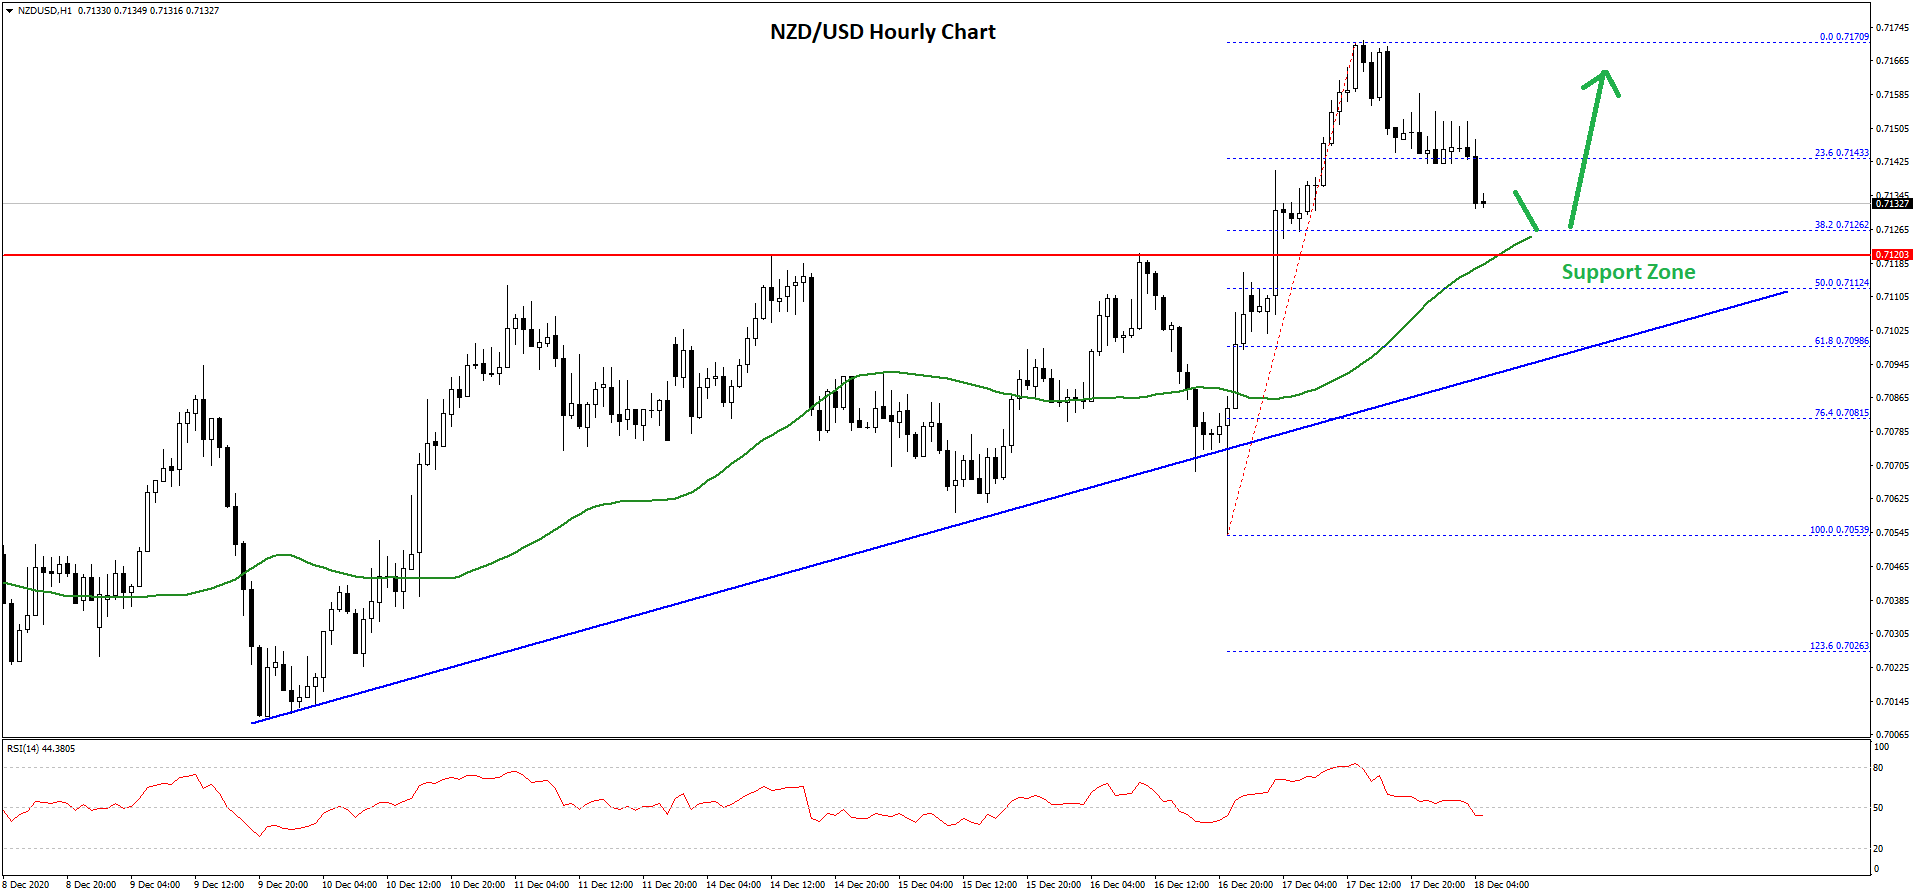
There was a break below the 0.7150 level. The pair even broke the 23.6% Fib retracement level of the upward move from the 0.7053 swing low to 0.7170 high. The pair is now approaching the key 0.7120 support level and the 50 hourly simple moving average.
There is also a key bullish trend line is forming with support near 0.7100 on the hourly chart of NZD/USD. The trend line is close to the 50% Fib retracement level of the upward move from the 0.7053 swing low to 0.7170 high.
If there is a downside break below the trend line support, there is a risk of more losses towards the 0.7080 and 0.7050 support levels. Conversely, the pair could start a fresh increase above the 0.7150 and 0.7160 resistance levels.
Trade over 50 forex markets 24 hours a day with FXOpen. Take advantage of low commissions, deep liquidity, and spreads from 0.0 pips. Open your FXOpen account now or learn more about trading forex with FXOpen.
This article represents the opinion of the Companies operating under the FXOpen brand only. It is not to be construed as an offer, solicitation, or recommendation with respect to products and services provided by the Companies operating under the FXOpen brand, nor is it to be considered financial advice.
Latest from Forex Analysis
Latest articles

Weekly Market Wrap With Gary Thomson: UK100, Hang Seng Index, AUD/JPY, GBP/USD, USD/CAD
Get the latest scoop on the week's hottest headlines, all in one convenient video. Join Gary Thomson, the COO of FXOpen UK, as he breaks down the most significant news reports and shares his expert insights.
- UK100 Analysis: Stock Market

What Is the ICT Silver Bullet Strategy, and How Does It Work?
The ICT Silver Bullet strategy offers traders a unique approach to capitalising on market opportunities during specific trading hours. This article explored this advanced strategy, explaining the role of fair value gaps, liquidity, and timeframes and how to implement it.

Analytical Euro to Dollar Predictions for 2024-2025
The EUR/USD currency pair stands as a critical barometer of economic interactions and the relative strength between the Eurozone and the United States. This article delves into the recent history, economic outlooks, and analytical euro-to-dollar forecasts for this major