


FXOpen

AUD/USD started a fresh decline from well above 0.7800 and declined below 0.7750. NZD/USD is also declining and it seems like it could break the 0.7150 support zone.
Important Takeaways for AUD/USD and NZD/USD
- The Aussie Dollar started a fresh decline below the 0.7820 and 0.7800 support levels against the US Dollar.
- There was a break below a couple of bearish continuation patterns near 0.7800 and 0.7755 on the hourly chart of AUD/USD.
- NZD/USD declined sharply after it failed to surpass the 0.7270 resistance area.
- There is a crucial bullish trend line forming with support near 0.7160 on the hourly chart of NZD/USD.
AUD/USD Technical Analysis
After a decent upward move above 0.7800, the Aussie Dollar faced sellers near 0.7850 against the US Dollar. The AUD/USD pair traded as high as 0.7848 on FXOpen and recently started a fresh decline.
There was a break below a few important supports near 0.7800. There was also a break below a couple of bearish continuation patterns near 0.7800 and 0.7755 on the hourly chart of AUD/USD.
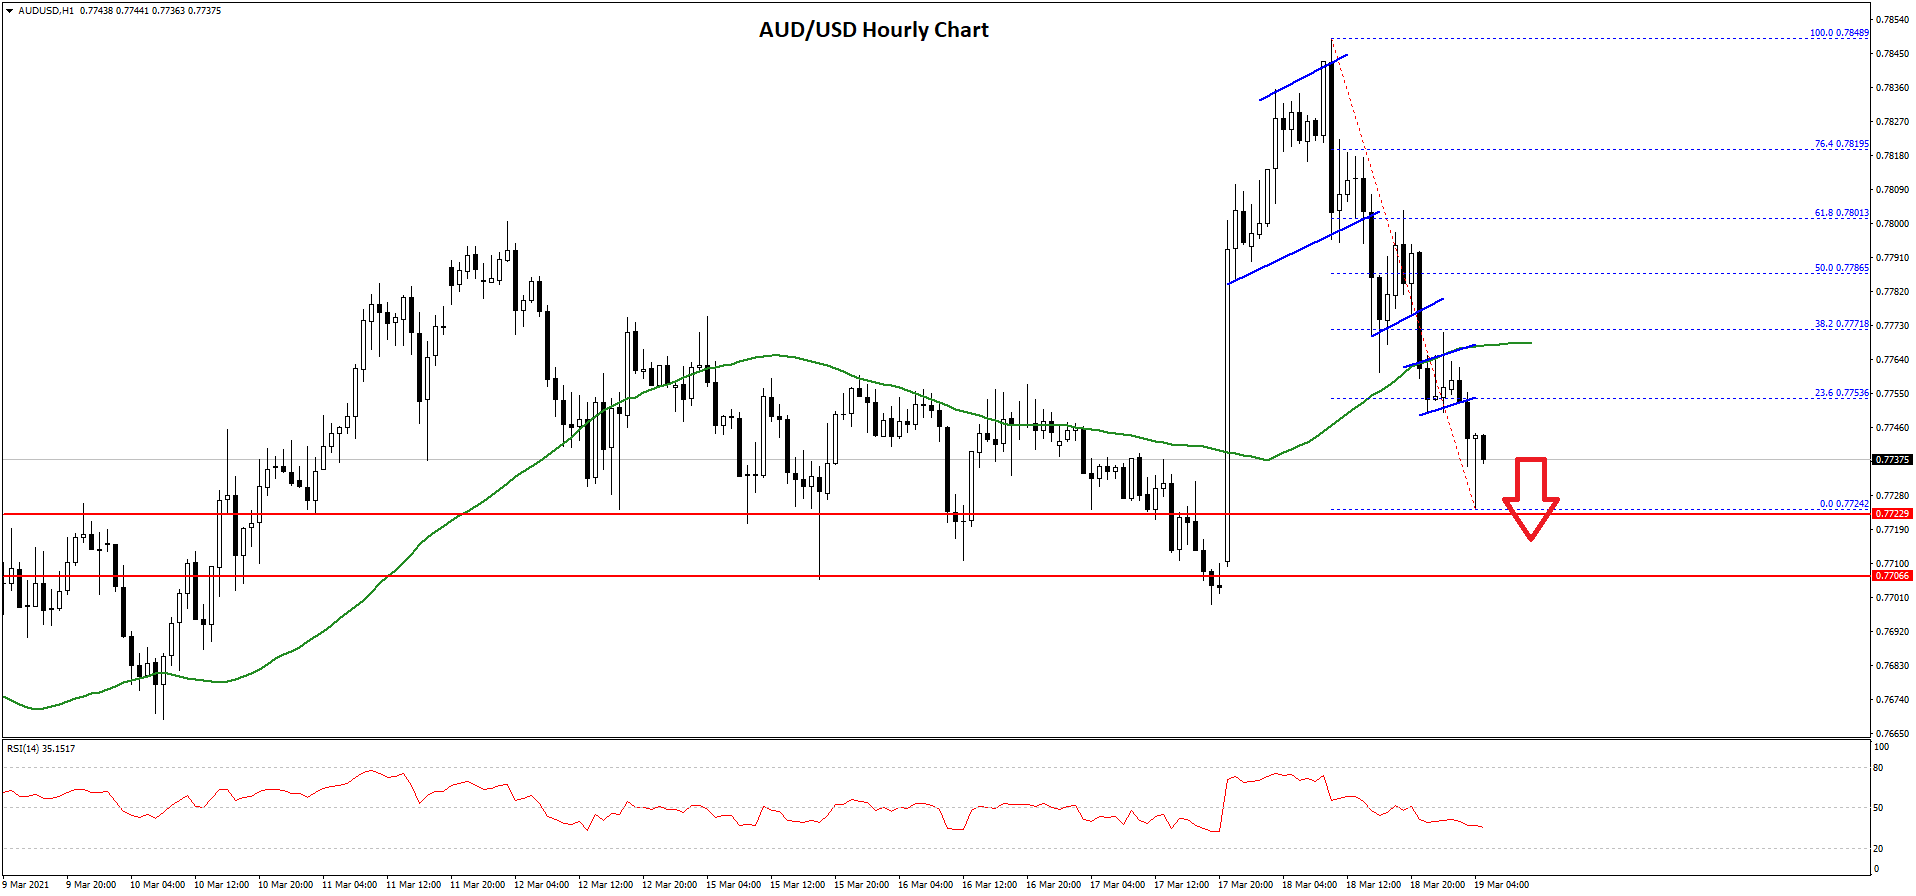
The pair even broke the 0.7780 support level and the 50 hourly simple moving average. A low is formed near 0.7724 on FXOpen and the pair is currently struggling to recover. An initial resistance on the upside is near the 0.7753 level.
It is close to the 23.6% Fib retracement level of the downward move from the 0.7848 high to 0.7724 low. The next major resistance is near the 0.7770 level or the 50 hourly simple moving average.
The main resistance is forming near the 0.7785 level. The 50% Fib retracement level of the downward move from the 0.7848 high to 0.7724 low is also near 0.7785. If there is no recovery above 0.7770 or 0.7785, there is a risk of more losses.
An initial support is near the 0.7725 level. If there is a downside break below 0.7725 and 0.7710, the pair could accelerate lower. In the stated case, it could even decline below 0.7700 and test 0.7650.
NZD/USD Technical Analysis
The New Zealand Dollar also followed a similar path after it failed to clear the 0.7270 resistance against the US Dollar. The NZD/USD pair broke the 0.7220 support level to move into a bearish zone.
The pair even broke the 0.7200 support level and settled well below the 50 hourly simple moving average. A low is formed near 0.7150 and the pair is currently showing a lot of bearish signs.
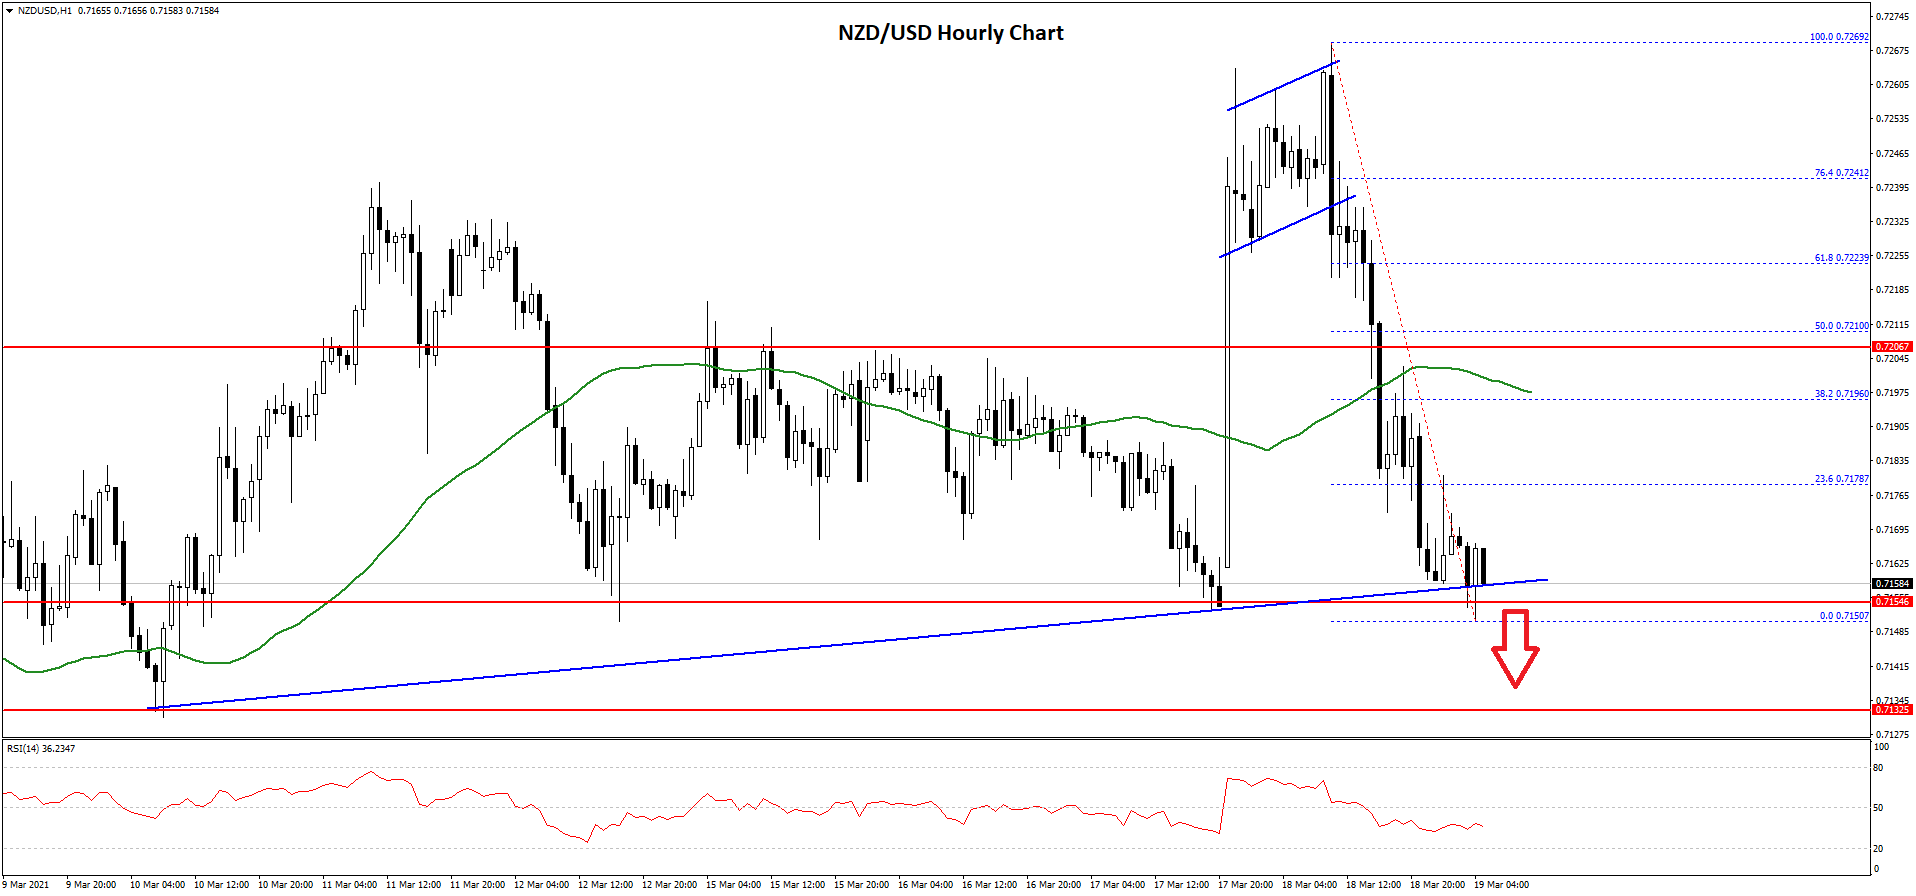
It seems like the bulls are attempting to protect the 0.7150 support. There is also a crucial bullish trend line forming with support near 0.7160 on the hourly chart of NZD/USD.
There was also a break below a major bullish trend line with support near 0.7160 on the hourly chart of NZD/USD. If there is a downside break below 0.7160 and 0.7150, the pair could accelerate lower. The next major support is near the 0.7100 level.
Conversely, the pair could attempt to correct higher above the 0.7175 and 0.7180 resistance levels. The first key resistance is near the 0.7195 level or the 50 hourly simple moving average. It is close to the 38.2% Fib retracement level of the downward move from the 0.7269 high to 0.7150 low.
The main resistance is near the 0.7210 zone. The 50% Fib retracement level of the downward move from the 0.7269 high to 0.7150 low is also near 0.7210. A clear break and close above the 0.7210 level could increase the chances of a steady increase towards 0.7270.
Trade over 50 forex markets 24 hours a day with FXOpen. Take advantage of low commissions, deep liquidity, and spreads from 0.0 pips. Open your FXOpen account now or learn more about trading forex with FXOpen.
This article represents the opinion of the Companies operating under the FXOpen brand only. It is not to be construed as an offer, solicitation, or recommendation with respect to products and services provided by the Companies operating under the FXOpen brand, nor is it to be considered financial advice.
Latest from Forex Analysis
Latest articles

Hong Kong-listed Chinese Insurer Goes on Rally as Western Giants Retract
The Asia Pacific region has once again become an area of great interest to investors and traders as some remarkable patterns of volatility have begun to make their presence felt.
This morning, a few examples of Hong Kong-listed Chinese companies

Bitcoin Price Bullish after Halving-2024
On April 19, 2024, a halving occurred in the Bitcoin network, resulting in the reward for the mined block amounting to 3.125 BTC.
Historically, after the halving (which is associated with a reduction in supply), the price of Bitcoin

What Is a Change of Character (CHoCH) and How Can You Trade It?
Navigating the nuances of Smart Money Concept (SMC) trading requires a keen understanding of market signals like the Change of Character (CHoCH). This concept can help traders detect and react to potential trend reversals. Today, we’ll delve into the