


FXOpen

AUD/USD gained momentum above the 0.7400 level before it faced sellers near 0.7445. NZD/USD is also correcting gains and it could test the 0.7020 support.
Important Takeaways for AUD/USD and NZD/USD
- The Aussie Dollar followed a bullish path above the 0.7350 and 0.7400 resistance levels against the US Dollar.
- There was a break above a key contracting triangle with resistance near 0.7385 on the hourly chart of AUD/USD.
- NZD/USD surged above 0.6950 and 0.7000, and even traded close to 0.7120.
- A major ascending channel is forming with support near 0.7055 on the hourly chart of NZD/USD.
AUD/USD Technical Analysis
In the past few days, the Aussie Dollar saw a steady increase above the 0.7320 pivot against the US Dollar. The AUD/USD pair even broke the 0.7400 resistance level to move into a positive zone.
During the increase, there was a break above a key contracting triangle with resistance near 0.7385 on the hourly chart of AUD/USD. The upward move gained pace above 0.7400 and the pair settled above the 50 hourly simple moving average.

It traded to a new monthly high at 0.7449 and recently started a downside correction. There was a break below the 0.7430 level. It is testing a key support zone near 0.7425, and the 23.6% Fib retracement level of the recent increase from the 0.7351 swing low to 0.7449 high.
If there are more losses and a downside break below 0.7425, the pair could extend losses towards the 0.7400 support. The 50 hourly simple moving average is also near the 0.7405 level to act as a support.
Moreover, the 50% Fib retracement level of the recent increase from the 0.7351 swing low to 0.7449 high is at 0.7400. Any more losses could lead the pair towards the 0.7350 support. Conversely, the pair could start a fresh increase above the 0.7440 level.
The first major resistance is near the 0.7450 level, above which AUD/USD could accelerate higher towards the 0.7500 level.
NZD/USD Technical Analysis
In the past few days, there was a major increase in the New Zealand Dollar above the 0.6950 resistance level against the US Dollar. The NZD/USD pair even surged above the 0.7000 resistance zone.
The pair climbed above the 0.7050 level and spiked above the 0.7100 level. A high is formed near 0.7104 and it is currently correcting lower. There was a break below the 0.7080 support level, and the pair broke the 50% Fib retracement level of the upward move from the 0.7031 swing low to 0.7104 high.
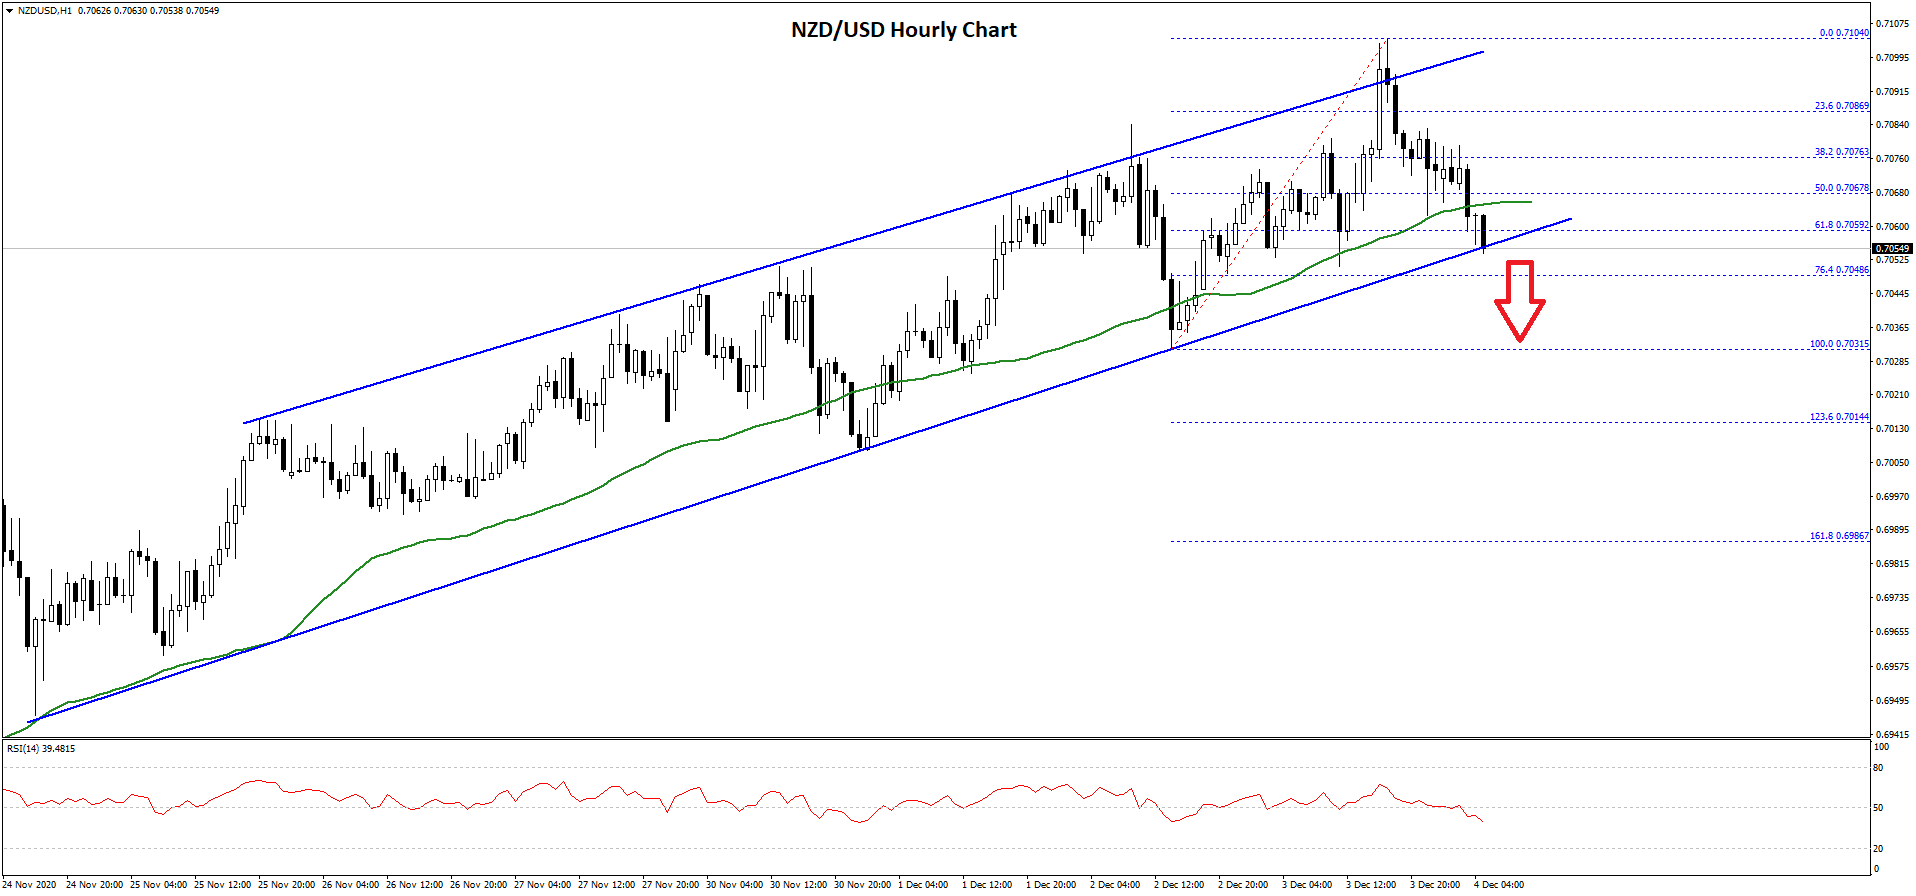
The pair is now trading below the 0.7070 level and the 50 hourly simple moving average. It is testing the 61.8% Fib retracement level of the upward move from the 0.7031 swing low to 0.7104 high.
There is also a major ascending channel is forming with support near 0.7055 on the hourly chart of NZD/USD. If there is a downside break below the channel support, there is a risk of more losses towards the 0.7040 and 0.7020 support levels.
Conversely, the pair could stay above the channel support and start a fresh increase above 0.7065. The first major resistance is near the 0.7080 level, above which the pair could make another attempt to settle above the 0.7100 level.
Trade over 50 forex markets 24 hours a day with FXOpen. Take advantage of low commissions, deep liquidity, and spreads from 0.0 pips. Open your FXOpen account now or learn more about trading forex with FXOpen.
This article represents the opinion of the Companies operating under the FXOpen brand only. It is not to be construed as an offer, solicitation, or recommendation with respect to products and services provided by the Companies operating under the FXOpen brand, nor is it to be considered financial advice.
Latest from Forex Analysis
Latest articles

Since the Start of the Week, Brent Oil Price Has Dropped over 4%
At the beginning of the week, March 15, we wrote that the price of Brent oil could form a correction from the resistance level of USD 91 per barrel. Since then, the price has decreased by more than 4% due

Fair Value Gaps vs Liquidity Voids in Trading
Understanding fair value gaps and liquidity voids is essential for traders seeking to navigate the complexities of the financial markets. These concepts, deeply rooted in the Smart Money Concept (SMC), provide valuable insights into the dynamics of supply and demand,

UK100 Share Index Rises as UK Inflation Slows
Yesterday, the UK Office for National Statistics (ONS) reported that the CPI stood at 3.2% in March. According to ForexFactory, analysts expected 3.1%, and a month ago the index was 3.4%.
Grant Fitzner, chief economist at the