


FXOpen

AUD/USD is slowly moving lower and it is now trading well below 0.7650. NZD/USD is also declining and it seems like it could revisit the 0.7100 support zone.
Important Takeaways for AUD/USD and NZD/USD
- The Aussie Dollar started a fresh decline below the 0.7700 and 0.7650 support levels against the US Dollar.
- There is a key bearish trend line forming with resistance near 0.7615 on the hourly chart of AUD/USD.
- NZD/USD is also moving lower and it is now trading below the 0.7200 support level.
- There was a break below a major bullish trend line with support near 0.7160 on the hourly chart of NZD/USD.
AUD/USD Technical Analysis
After struggling to gain momentum above the 0.7750 level, the Aussie Dollar started a fresh decline against the US Dollar. The AUD/USD pair broke the 0.7700 support level to move into a bearish zone.
The pair even cleared the 0.7650 support level and settled below the 50 hourly simple moving average. A low was formed near 0.7563 on FXOpen before the pair corrected higher. It recovered above the 0.7600 level, but there was no clear break above 0.7650.
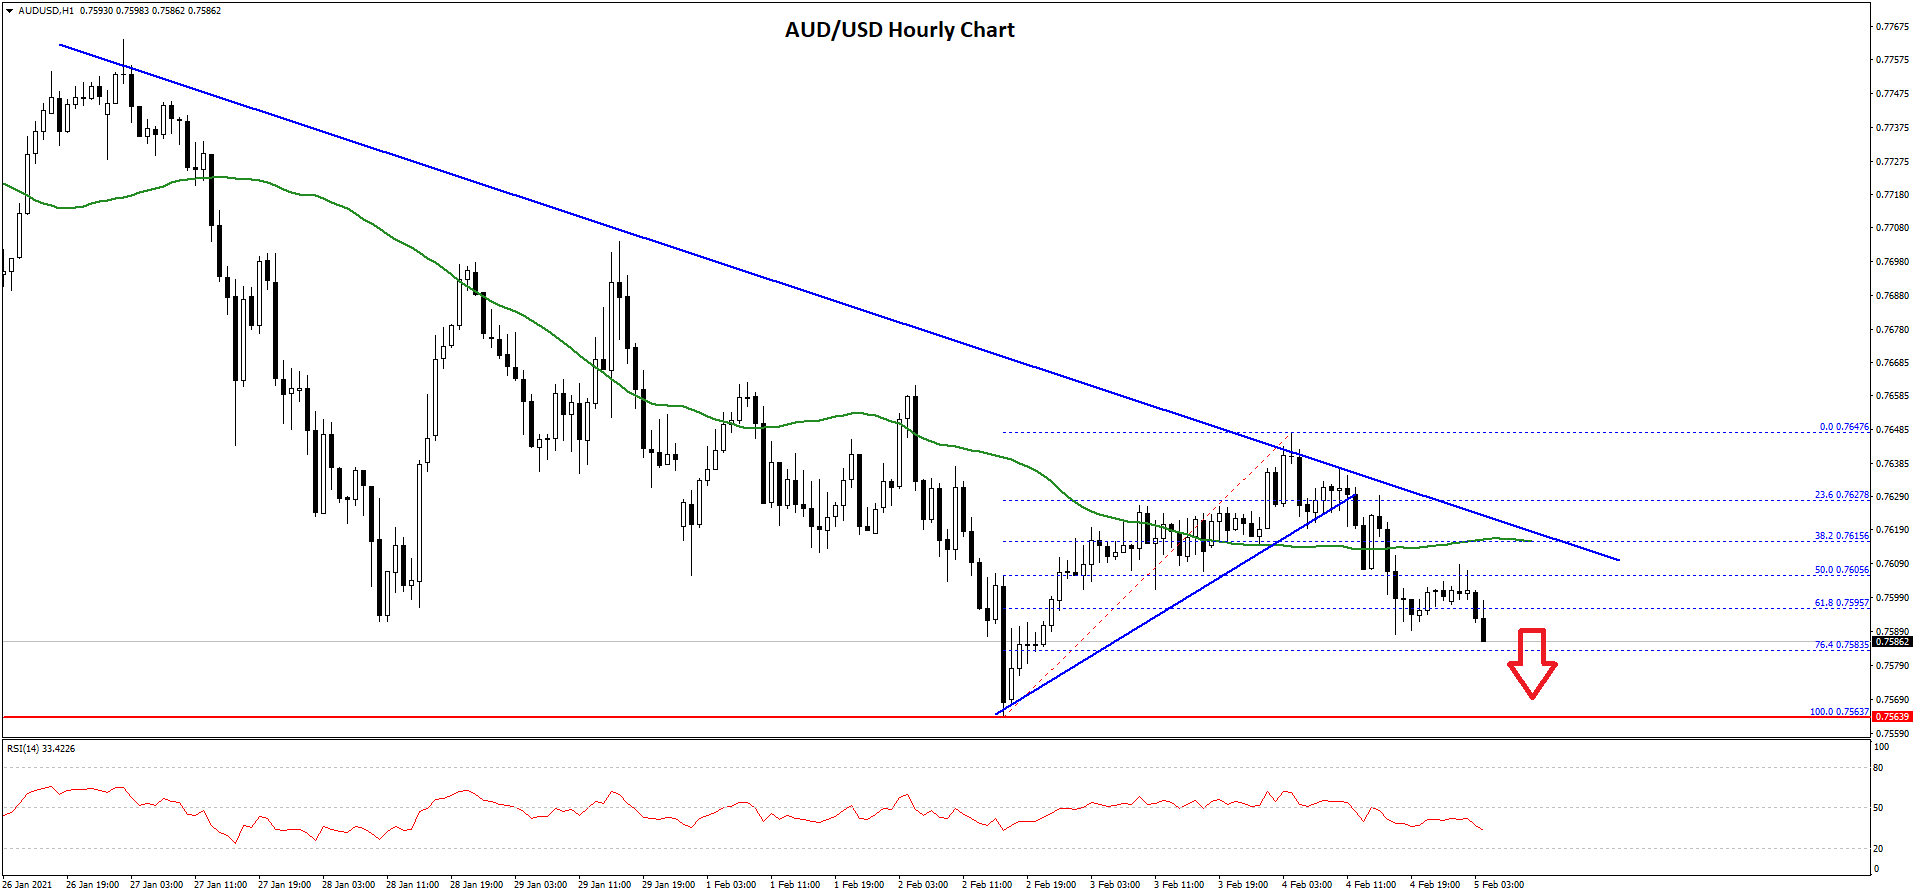
As a result, the pair started a fresh decline below the 0.7620 support. The pair even traded below the 50% Fib retracement level of the upward move from the 0.7563 low to 0.7647 high.
There is also a key bearish trend line forming with resistance near 0.7615 on the hourly chart of AUD/USD. It is now testing the 0.7585 support, which is close to the 76.4% Fib retracement level of the upward move from the 0.7563 low to 0.7647 high.
If there is a downside break, the pair could test the 0.7550 support. Any more losses may possibly open the doors for a push towards the 0.7500 level.
On the upside, the 0.7615 level is a major resistance along with the 50 hourly simple moving average. A clear break above the 0.7615 and 0.7620 levels may possibly open the doors for a fresh increase towards 0.7700 in the coming sessions.
NZD/USD Technical Analysis
The New Zealand Dollar also followed a similar path after it failed to clear the 0.7220 resistance against the US Dollar. The NZD/USD pair broke the 0.7200 support level to start the current decline.
The pair broke the 0.7180 support level and settled well below the 50 hourly simple moving average. There was also a break below a major bullish trend line with support near 0.7160 on the hourly chart of NZD/USD.
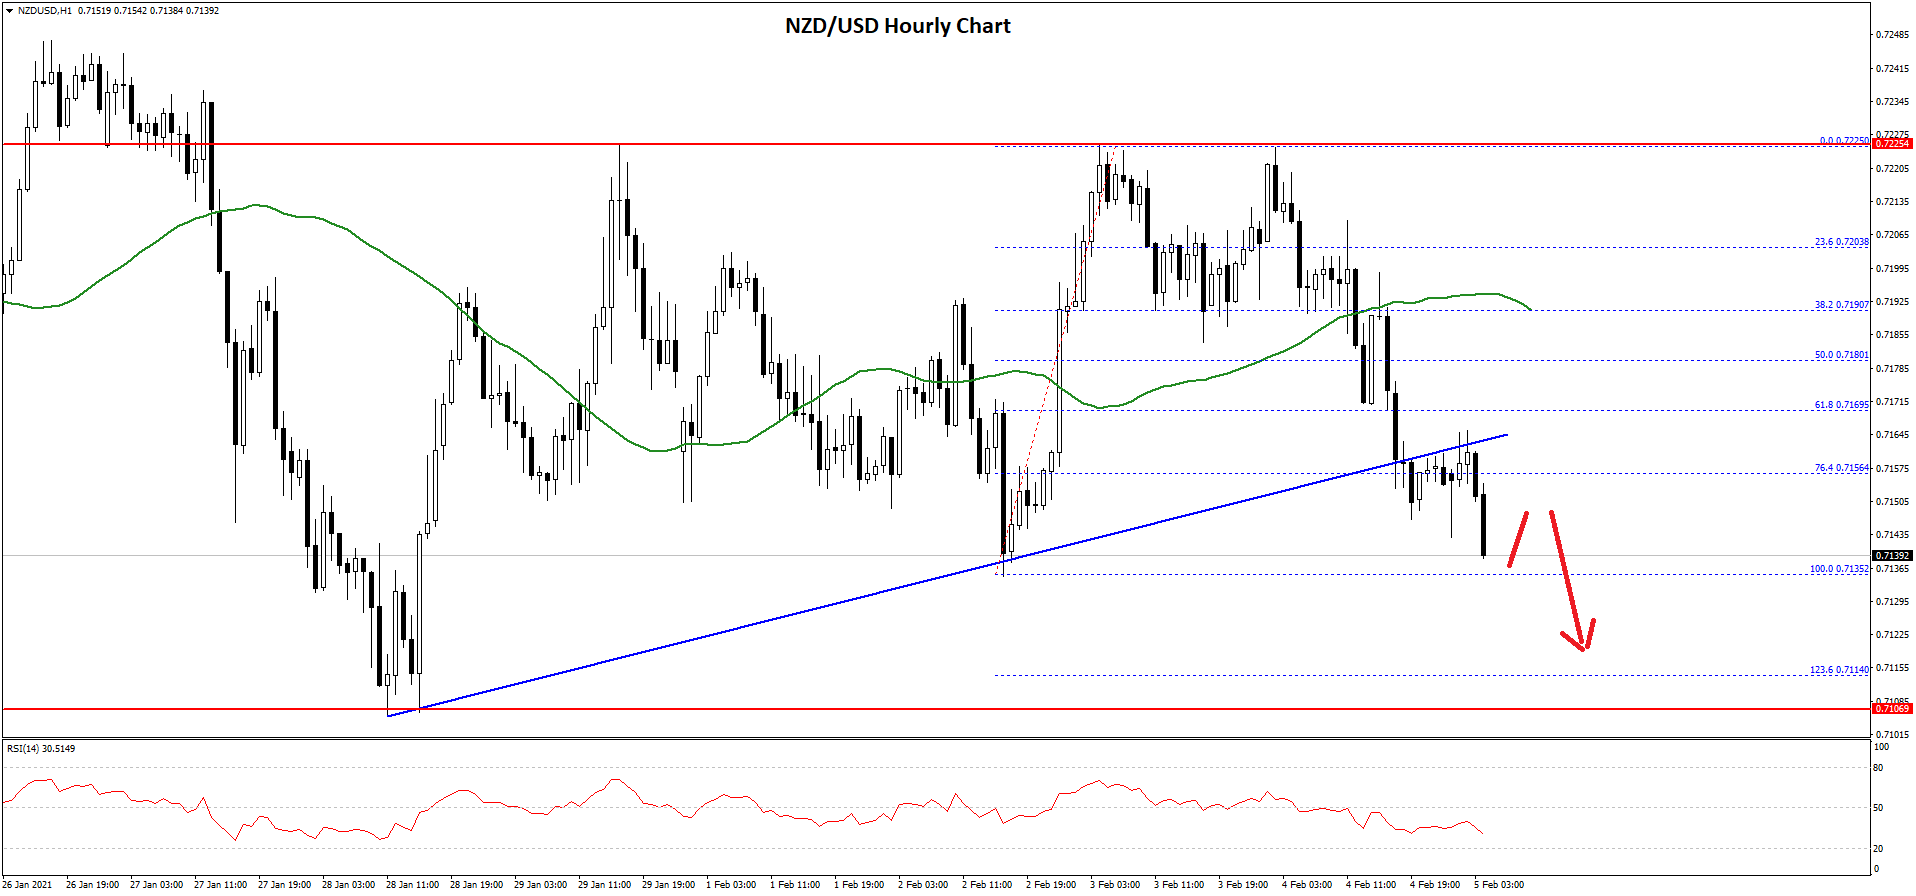
The pair is now trading below the 76.4% Fib retracement level of the upward move from the 0.7135 low to 0.7225 high. It is testing the last swing low at 0.7135 and it is likely to continue lower.
The next key support is near the 0.7110 level. It is close to the 1.236 Fib extension level of the upward move from the 0.7135 low to 0.7225 high. Any more losses could push the pair below the 0.7100 support level.
Conversely, the pair could attempt to correct higher above the 0.7155 and 0.7160 resistance levels. The main resistance is near the 0.7200 zone. A clear break and close above the 0.7200 level could increase the chances of more gains above the 0.7220 resistance.
Trade over 50 forex markets 24 hours a day with FXOpen. Take advantage of low commissions, deep liquidity, and spreads from 0.0 pips. Open your FXOpen account now or learn more about trading forex with FXOpen.
This article represents the opinion of the Companies operating under the FXOpen brand only. It is not to be construed as an offer, solicitation, or recommendation with respect to products and services provided by the Companies operating under the FXOpen brand, nor is it to be considered financial advice.
Latest from Forex Analysis
Latest articles

Google Share Price Rose Post-market to a New All-time Record
Yesterday, after the close of the main trading session, a report on activities for the 1st quarter of Alphabet Inc. (Google's parent company) was published. The report was strong, exceeding investors' expectations.
→ Quarterly EPS = USD 1.89 (expected = USD 1.

S&P 500 Rebounds after Negative GDP News
Data released yesterday showed US GDP growth slowed to 1.6% in the first quarter of the year. According to ForexFactory: forecast = 2.2%, past value = 2.4%.
Reaction to the news sent the S&P 500 mini stock

GBP/USD And USD/CAD Daily Chart Outlook
GBP/USD is attempting a recovery wave from 1.2300. USD/CAD is consolidating and might aim for a move above the 1.3760 resistance zone.
Important Takeaways for GBP/USD and USD/CAD Analysis Today
· The British Pound started