


FXOpen

AUD/USD remained in a positive zone and climbed above the 0.7700 resistance. NZD/USD is also showing positive signs and it is likely to continue higher above 0.7220.
Important Takeaways for AUD/USD and NZD/USD
- The Aussie Dollar extended its rally above the 0.7600 and 0.7700 resistance levels against the US Dollar.
- There is a major bullish trend line forming with support near 0.7695 on the hourly chart of AUD/USD.
- NZD/USD climbed higher towards the 0.7240 level before correcting lower.
- A key bullish trend line is forming with support near 0.7160 on the hourly chart of NZD/USD.
AUD/USD Technical Analysis
In the past few weeks, the Aussie Dollar remained in a bullish zone above the 0.7500 pivot level against the US Dollar. The AUD/USD pair even broke the 0.7650 resistance level to move further into a positive zone.
The pair followed a bullish path and it even broke the 0.7700 resistance and the 50 hourly simple moving average. A new multi-month high is formed near 0.7742 on FXOpen and the pair is currently correcting lower.
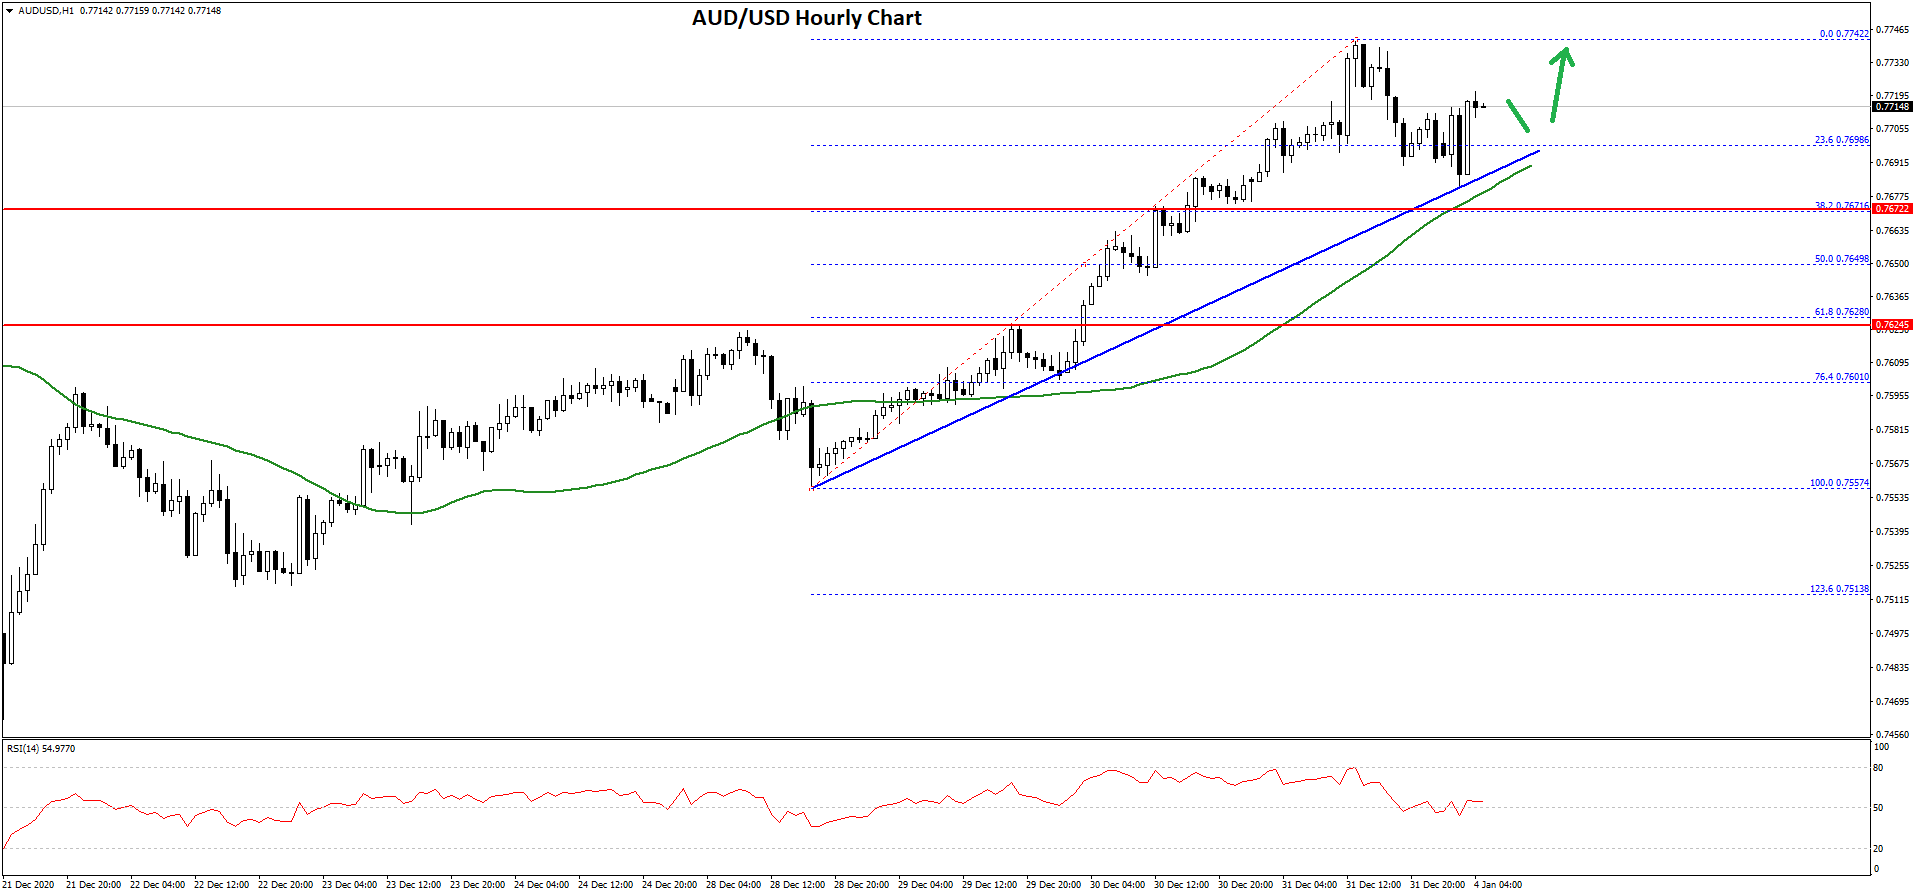
There was a break below the 0.7720 support level. The pair even spiked below the 23.6% Fib retracement level of the recent wave from the 0.7557 swing low to 0.7742 high.
However, the pair is finding a strong support near the 0.7700 zone. There is also a major bullish trend line forming with support near 0.7695 on the hourly chart of AUD/USD. The 50 hourly simple moving average is also following the trend line at 0.7690.
If there is a downside break below the trend line and the 50 hourly simple moving average, there is a risk of more downsides towards the 0.7670 support. The next major support is near 0.7650 or the 50% Fib retracement level of the recent wave from the 0.7557 swing low to 0.7742 high.
On the upside, the 0.7740 level is a decent resistance. A clear break above the 0.7740 and 0.7750 levels may possibly open the doors for a larger increase in the coming sessions.
NZD/USD Technical Analysis
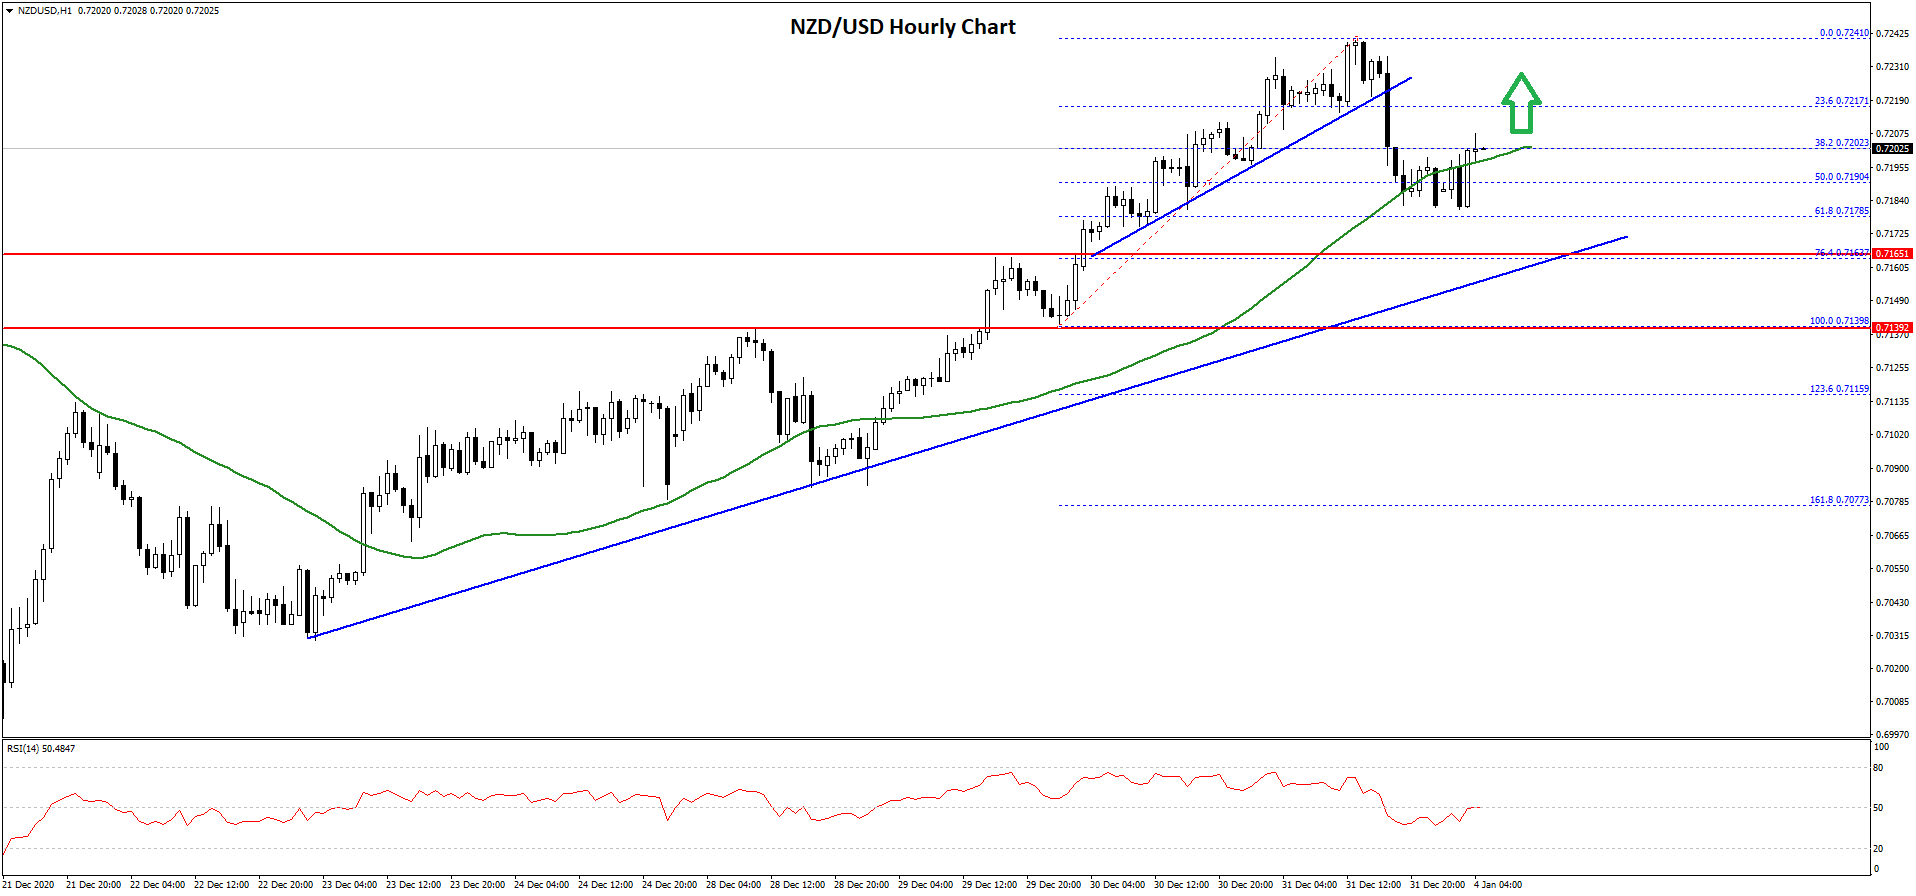
The New Zealand Dollar also followed a bullish path above the 0.7100 region against the US Dollar. The NZD/USD pair remained well bid and it even climbed above the 0.7200 resistance.
The pair traded close to the 0.7250 level and a new multi-month high was formed near 0.7241. Recently, there was a downside correction below the 0.7220 support. The pair traded below a connecting bullish trend line with support at 0.7220 on the hourly chart.
 aud
aud
There was also a spike below 0.7200, the 50 hourly simple moving average, and the 50% Fib retracement level of the upward move from the 0.7139 swing low to 0.7241 high.
However, the pair remained well bid near the 0.7180 level. It also remained stable above the 61.8% 50 hourly simple moving average. There is also a key bullish trend line forming with support near 0.7160 on the hourly chart of NZD/USD.
If there is a downside break below the trend line support, there is a risk of more losses towards the 0.7140 and 0.7120 support levels.
Conversely, the pair could start a fresh increase above the 0.7220 and 0.7225 resistance levels. In the stated case, NZD/USD might even test the 0.7300 level in the coming days.
Trade over 50 forex markets 24 hours a day with FXOpen. Take advantage of low commissions, deep liquidity, and spreads from 0.0 pips. Open your FXOpen account now or learn more about trading forex with FXOpen.
This article represents the opinion of the Companies operating under the FXOpen brand only. It is not to be construed as an offer, solicitation, or recommendation with respect to products and services provided by the Companies operating under the FXOpen brand, nor is it to be considered financial advice.
Latest from Forex Analysis
Latest articles

Anchored VWAP and How You Can Use It in Forex Trading
In the world of forex trading, understanding the nuanced tools at your disposal can significantly enhance decision-making processes. One such sophisticated tool is the Anchored Volume-Weighted Average Price (Anchored VWAP), which refines the standard VWAP by allowing traders to set

META Share Price Collapses after Publication of Quarterly Report
Just yesterday, META's stock price closed at USD 493.50, up approximately 40% since the start of 2024 and up nearly 300% since the start of 2023.
However, following the release of Meta's quarterly report, its shares plummeted to USD

USD/JPY Analysis: The Rate Exceeds The Level of 155 Yen Per US Dollar
Today, the price of USD/JPY once again renewed its 34-year high, exceeding the level of 155 yen per dollar, which put pressure on the current authorities.
According to Reuters, officials are trying to maintain calm in the market.
"We