


FXOpen

AUD/USD started a fresh decline from well above the 0.7400 level. NZD/USD also declined below the 0.7020 and 0.7000 support levels.
Important Takeaways for AUD/USD and NZD/USD
- The Aussie Dollar started a major decline after it failed to clear 0.7440 against the US Dollar.
- There is a major bearish trend line forming with resistance near 0.7365 on the hourly chart of AUD/USD.
- NZD/USD also started a fresh decline from well above the 0.7050 level.
- There was a break below a key contracting triangle with support near 0.7015 on the hourly chart of NZD/USD.
AUD/USD Technical Analysis
After struggling to clear the 0.7440 resistance, the Aussie Dollar started a major decline against the US Dollar. The AUD/USD pair broke the 0.7400 and 0.7380 support levels to move into a bearish zone.
The pair even broke the 0.7350 support and the 50 hourly simple moving average. Recently, there was a recovery wave, but the pair failed to clear the 0.7400 resistance zone. It is now trading below the 0.7345 level and traded as low as 0.7332 on FXOpen.
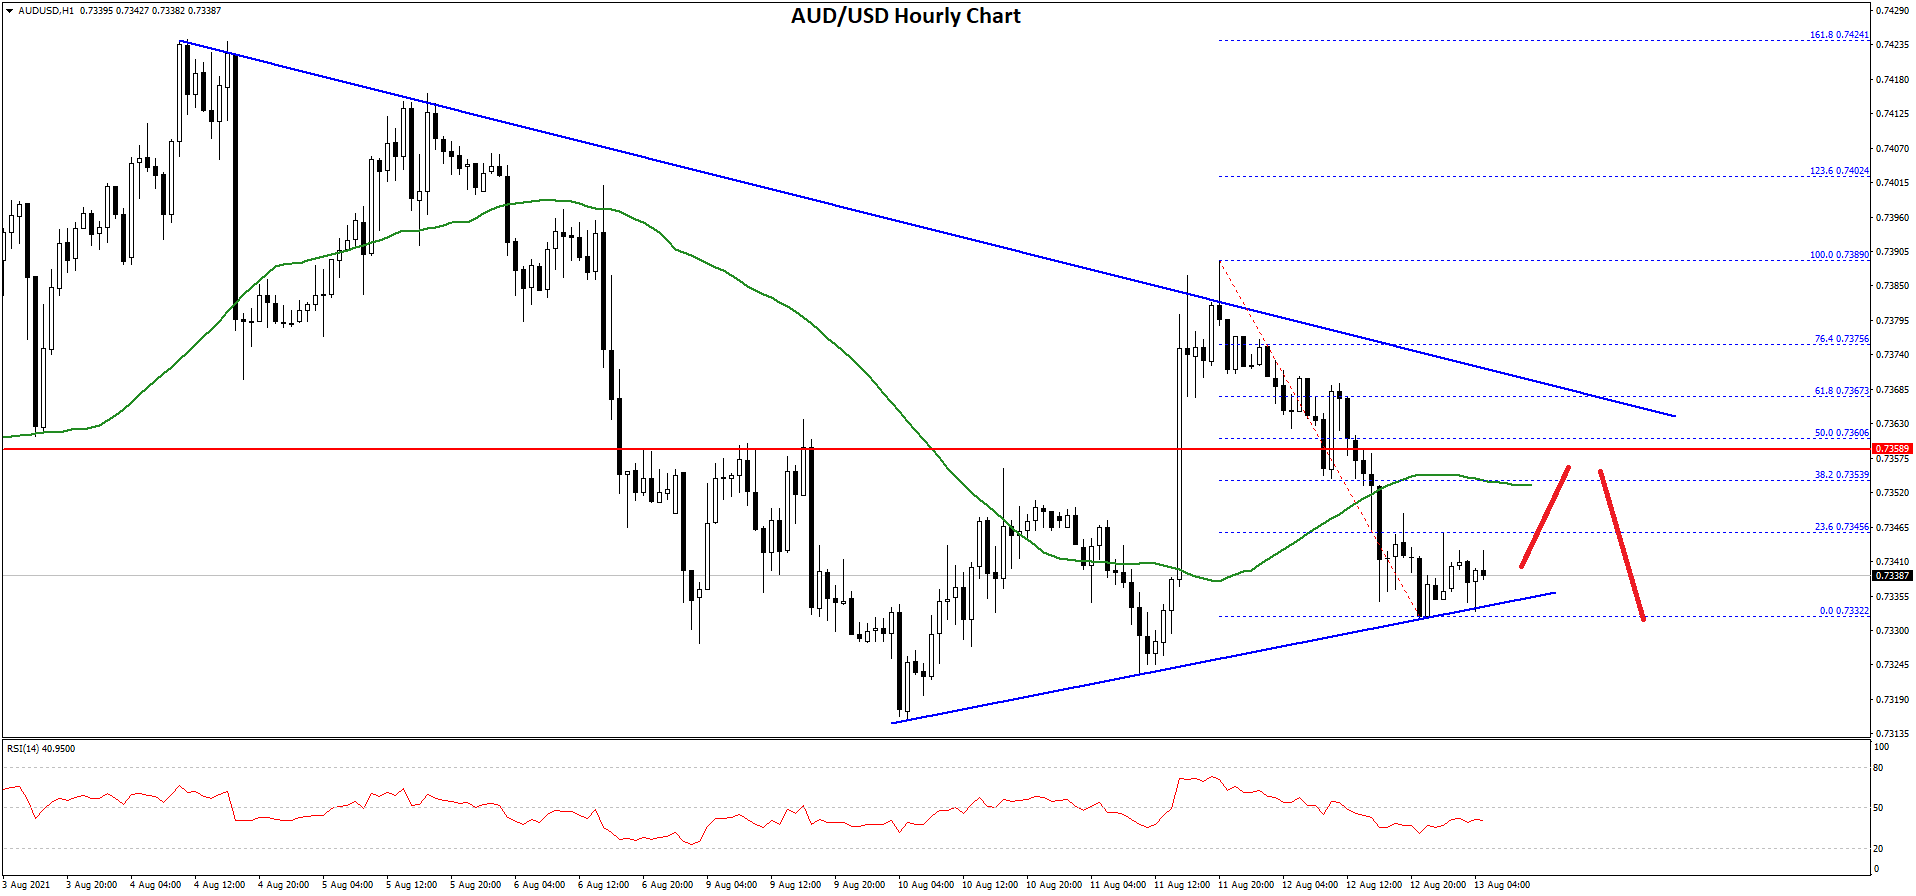
It is now consolidating losses above the 0.7335 level. An immediate resistance is near the 0.7355 level and the 50 hourly simple moving average. It is near the 38.2% Fib retracement level of the recent decline from the 0.7389 swing high to 0.7332 low.
The next major resistance is near the 0.7360 level. It is close to the 50% Fib retracement level of the recent decline from the 0.7389 swing high to 0.7332 low.
There is also a major bearish trend line forming with resistance near 0.7365 on the hourly chart of AUD/USD. To move into a positive zone, the pair must settle above 0.7360 and the 50 hourly SMA.
An initial support on the downside is near the 0.7335 level. The next major support is near the 0.7320 level. If there is a downside break below the 0.7320 support, the pair could extend its decline towards the 0.7250 level.
NZD/USD Technical Analysis
The New Zealand Dollar also followed a similar path after it topped near the 0.7080 level against the US Dollar. The NZD/USD pair broke the 0.7050 support zone to move into a bearish zone.
There was also a break below a key contracting triangle with support near 0.7015 on the hourly chart of NZD/USD. The pair traded below the 0.7010 level and the 50 hourly simple moving average. Besides, it spiked below the 61.8% Fib retracement level of the upward move from the 0.6969 swing low to 0.7061 high.
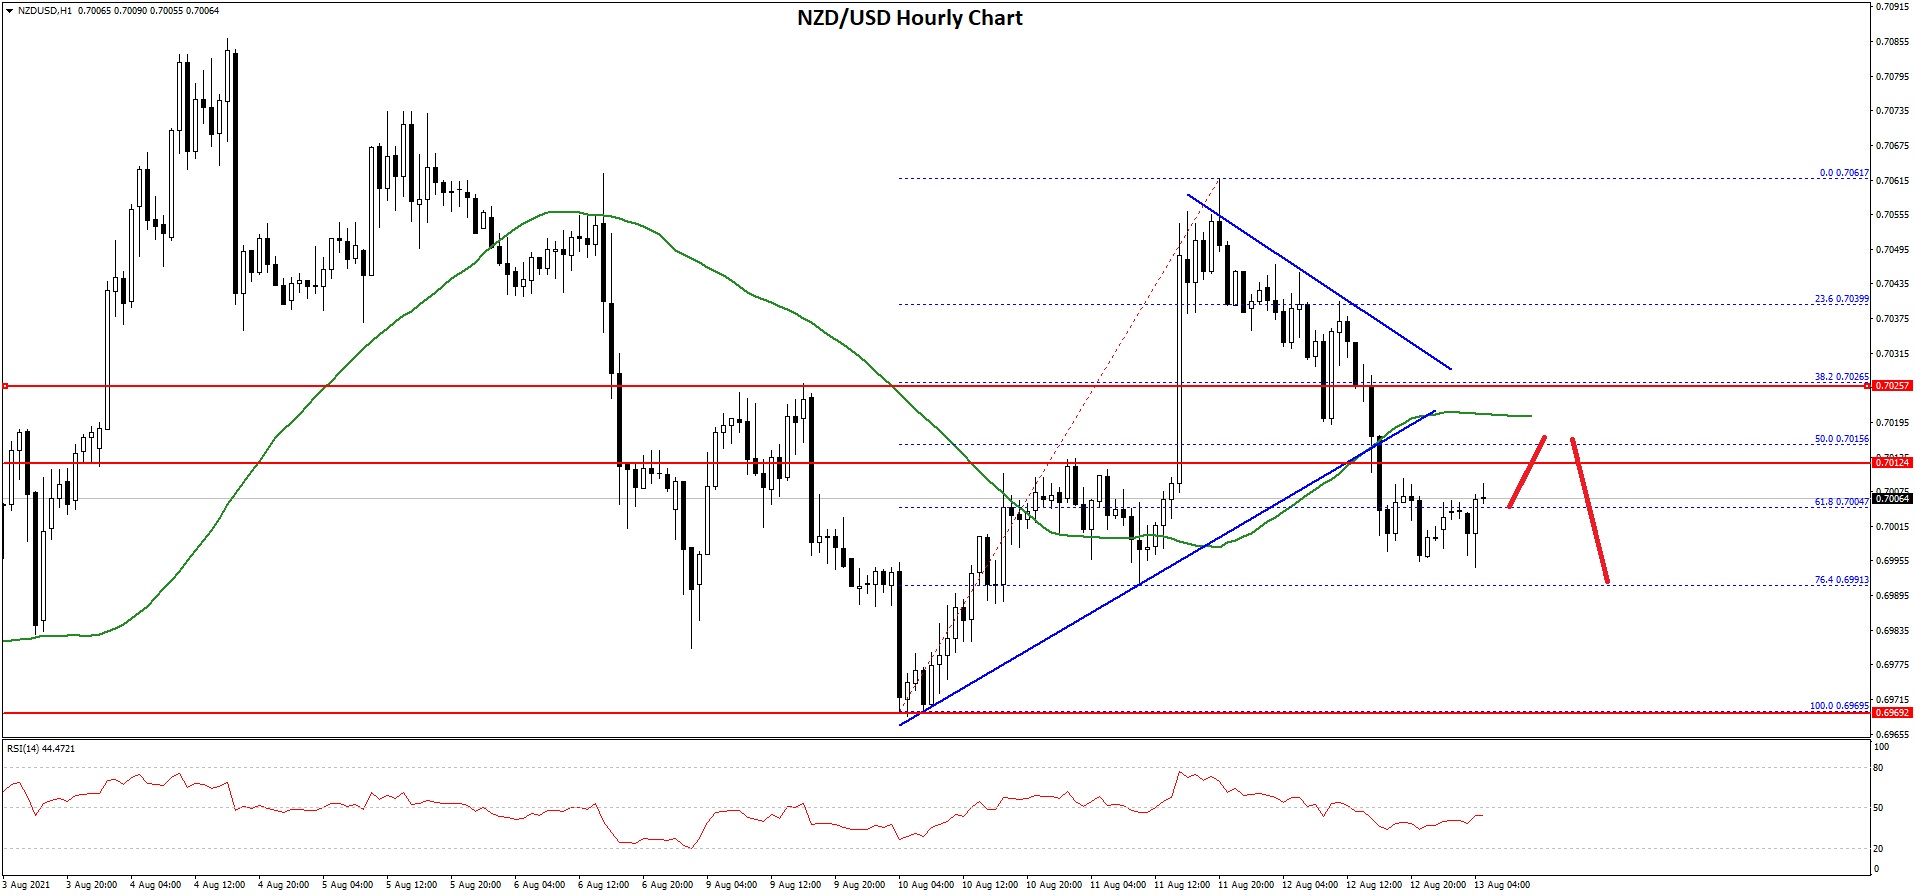
An initial support on the downside is near the 0.6990 level. It is close to the 76.4% Fib retracement level of the upward move from the 0.6969 swing low to 0.7061 high.
The next major support is near the 0.6970 level. If there is a downside break below the 0.6970 support, the NZD/USD pair could extend its decline towards the 0.6925 level. On the upside, an immediate resistance is near the 0.7015 level.
The next major resistance is near the 0.7020 level and the 50 hourly SMA. To move into a positive zone, the pair must settle above 0.7020 and the 50 hourly SMA. In the stated case, the pair is likely to revisit the 0.7070 resistance zone in the near term.
This forecast represents FXOpen Markets Limited opinion only, it should not be construed as an offer, invitation or recommendation in respect to FXOpen Markets Limited products and services or as financial advice.
Trade over 50 forex markets 24 hours a day with FXOpen. Take advantage of low commissions, deep liquidity, and spreads from 0.0 pips. Open your FXOpen account now or learn more about trading forex with FXOpen.
This article represents the opinion of the Companies operating under the FXOpen brand only. It is not to be construed as an offer, solicitation, or recommendation with respect to products and services provided by the Companies operating under the FXOpen brand, nor is it to be considered financial advice.
Latest from Forex Analysis
Latest articles

AUD/USD Analysis: Aussie Weakens After RBA Decision
Following its decision on 7th May, the Reserve Bank of Australia (RBA) opted to maintain the interest rate at 4.35%, despite inflation continuing to decrease at a slower pace than anticipated by the RBA.
"I think we still think

The Hang Seng Index Has Risen by Over 13% in 2 Weeks
Analyzing the Hang Seng (Hong Kong 50 at FXOpen) chart, we wrote on January 30th that the price was near an important support level formed by the lower boundary (shown in orange) of a long-term channel, which has been relevant

Turtle Trading: System, Rules, and Strategy
In the 1980s, the Turtle Trading system was born from a debate about whether trading skills were innate or could be taught. Richard Dennis and William Eckhardt decided to train novices in their trend-following trading strategies, thus giving rise to