


FXOpen
AUD/USD is gaining bullish momentum and it could break the 0.7100 resistance. Similarly, NZD/USD is trading nicely above the 0.6820 support and it may continue to climb higher.
Important Takeaways for AUD/USD and NZD/USD
- The Aussie Dollar formed a solid support near 0.7040 and climbed higher against the US Dollar.
- There is a major bullish trend line in place with support at 0.7050 on the hourly chart of AUD/USD.
- NZD/USD traded higher and broke the 0.6820 and 0.6830 resistance levels.
- There is a crucial contracting triangle in place with resistance at 0.6855 on the hourly chart.
AUD/USD Technical Analysis
After a strong rejection near the 0.7200 resistance, the Aussie Dollar declined below 0.7050 against the US Dollar. The AUD/USD pair traded close to the 0.7040 support level before it started a fresh upward move.
The pair traded as low as 0.7041 on FXOpen and later recovered above 0.7050. There was a break above the 0.7075 resistance and the 50 hourly simple moving average. The pair cleared the 50% Fib retracement level of the recent decline from the 0.7097 high to 0.7041 low.
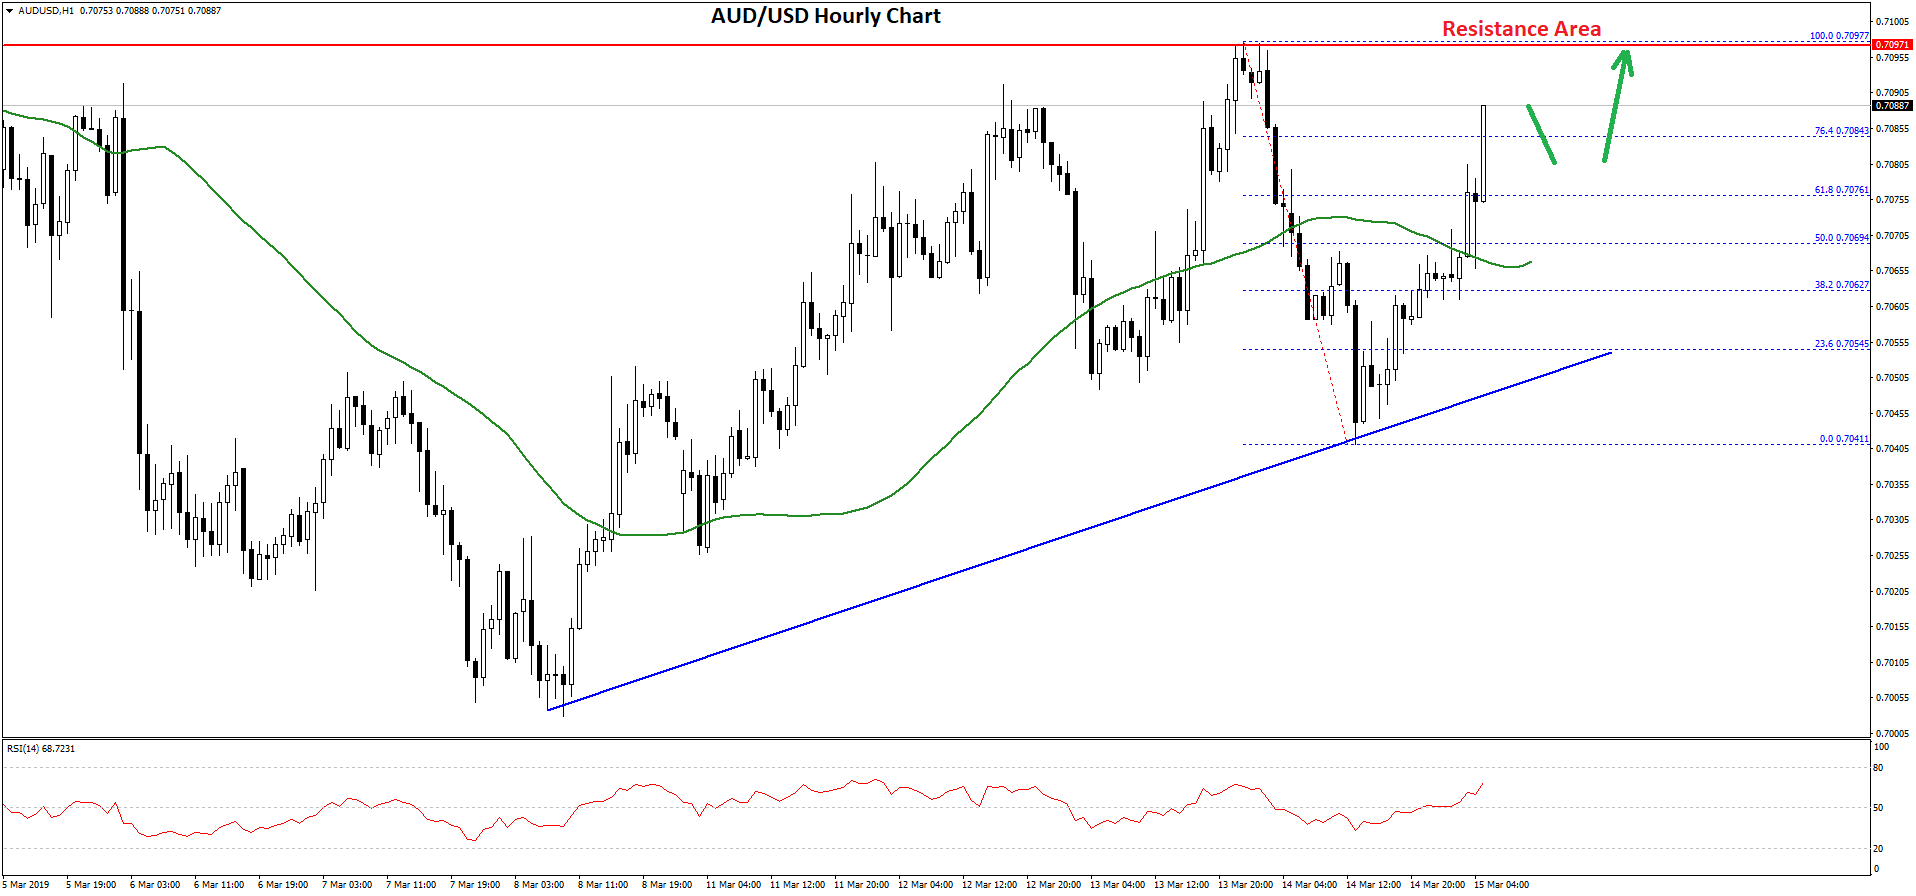
The recent upward move was strong as the pair even broke the 0.7080 resistance to open the doors for more gains. It is now trading nicely above the 76.4% Fib retracement level of the recent decline from the 0.7097 high to 0.7041 low.
Therefore, there are high chances of an upside break above the 0.7097 swing high. In the mentioned case, the pair could even break the 0.7100 and 0.7120 resistance levels.
On the other hand, if there is a downside correction, the pair might find support near the 0.7075 and 0.7060 levels. There is also a major bullish trend line in place with support at 0.7050 on the hourly chart of AUD/USD.
Overall, the pair remains well supported on the downside and it could continue to move higher towards the 0.7120 and 0.7140 levels.
NZD/USD Technical Analysis
The New Zealand Dollar also started a decent upward move after it corrected towards the 0.6800 support level against the US Dollar. The NZD/USD traded as low as 0.6808 and later started a fresh upward move.
It broke the 0.6820 resistance level and the 50 hourly simple moving average. Besides, there was a break above the 50% Fib retracement level of the recent decline from the 0.6864 high to 0.6808 low.
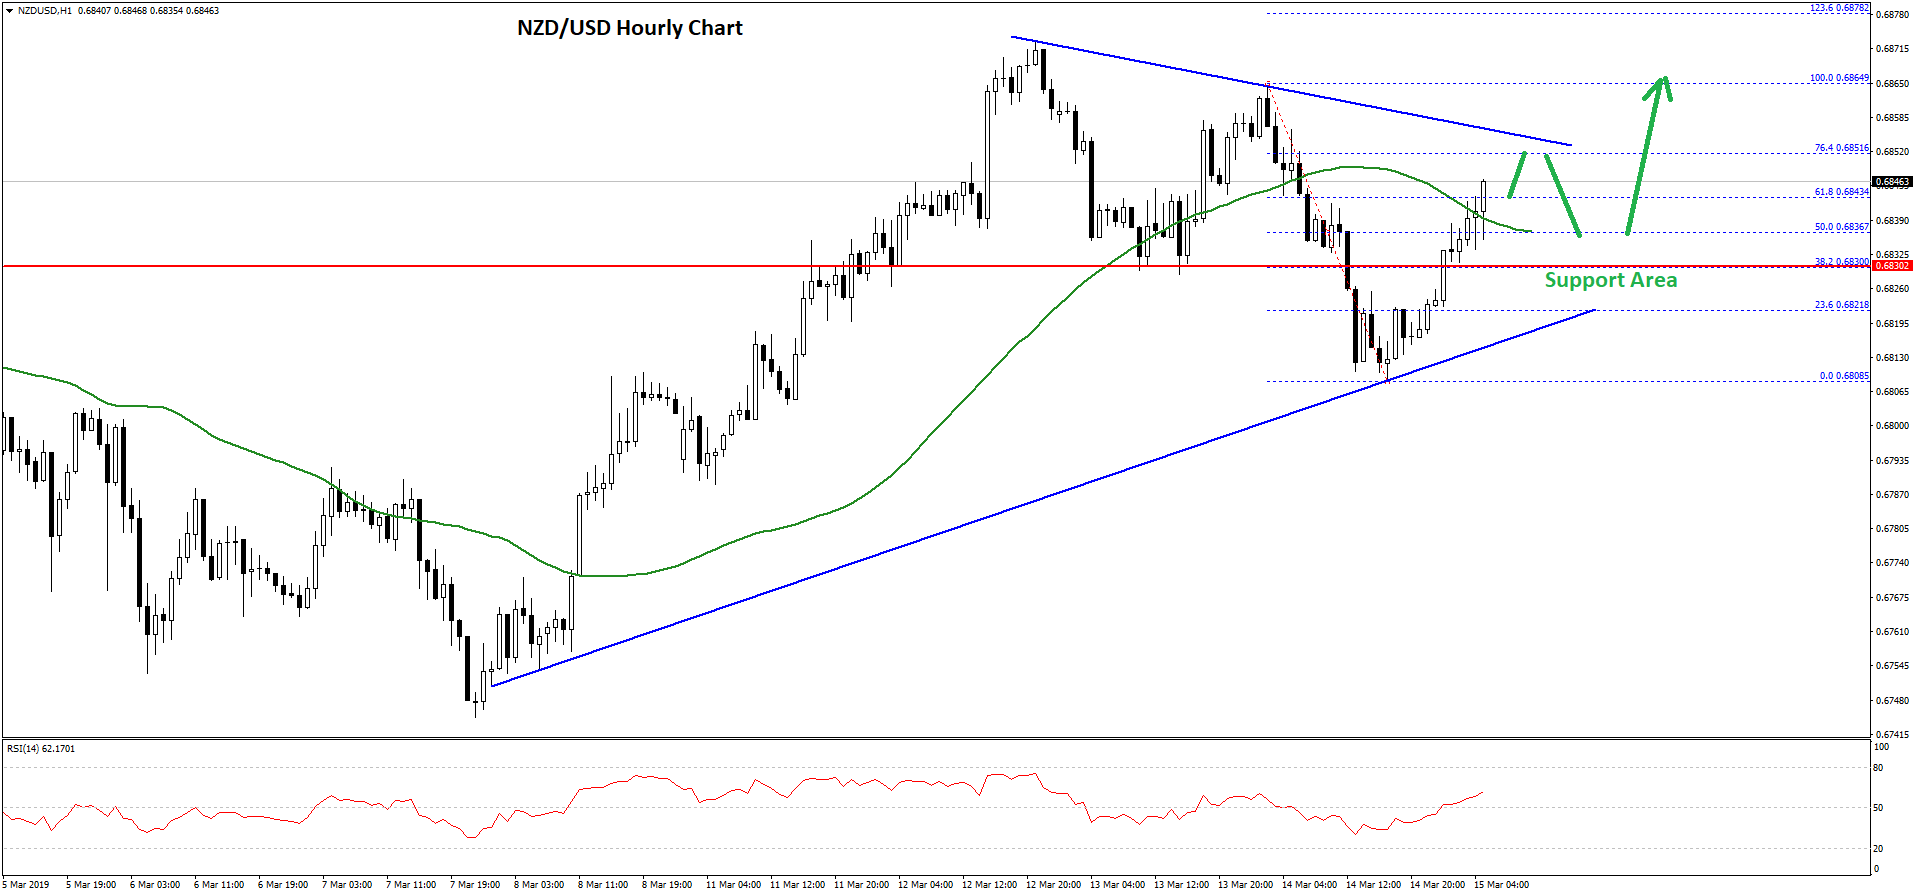
However, there is a strong resistance formed near the 0.6850 and 0.6860 levels. There is also a crucial contracting triangle in place with resistance at 0.6855 on the hourly chart. At the moment, the pair is trading close to the 76.4% Fib retracement level of the recent decline from the 0.6864 high to 0.6808 low.
In the short term, there could be a minor downside correction, but the 0.6835 and 0.6830 levels are likely to act as strong supports. The next key support is at 0.6820, below which the pair could move into a bearish zone.
On the upside, a convincing break above the 0.6860 resistance may open the doors for more gains. The next major resistance is near the 0.6875, above which the NZD/USD pair is likely to test the 0.6900 resistance level in the near term.
Trade over 50 forex markets 24 hours a day with FXOpen. Take advantage of low commissions, deep liquidity, and spreads from 0.0 pips. Open your FXOpen account now or learn more about trading forex with FXOpen.
This article represents the opinion of the Companies operating under the FXOpen brand only. It is not to be construed as an offer, solicitation, or recommendation with respect to products and services provided by the Companies operating under the FXOpen brand, nor is it to be considered financial advice.
Latest from Forex Analysis
Latest articles

Since the Start of the Week, Brent Oil Price Has Dropped over 4%
At the beginning of the week, March 15, we wrote that the price of Brent oil could form a correction from the resistance level of USD 91 per barrel. Since then, the price has decreased by more than 4% due

Fair Value Gaps vs Liquidity Voids in Trading
Understanding fair value gaps and liquidity voids is essential for traders seeking to navigate the complexities of the financial markets. These concepts, deeply rooted in the Smart Money Concept (SMC), provide valuable insights into the dynamics of supply and demand,

UK100 Share Index Rises as UK Inflation Slows
Yesterday, the UK Office for National Statistics (ONS) reported that the CPI stood at 3.2% in March. According to ForexFactory, analysts expected 3.1%, and a month ago the index was 3.4%.
Grant Fitzner, chief economist at the