


FXOpen

AUD/USD started a major decline after it failed to clear the 0.7765 resistance. NZD/USD also declined and it broke a major support near the 0.7200 zone.
Important Takeaways for AUD/USD and NZD/USD
- The Aussie Dollar started a fresh decline below the 0.7740 and 0.7700 support levels against the US Dollar.
- There was a break below a major bullish trend line with support near 0.7730 on the hourly chart of AUD/USD.
- NZD/USD also declined heavily below the 0.7200 and 0.7180 support levels.
- There is a key bearish trend line forming with resistance near 0.7200 on the hourly chart of NZD/USD.
AUD/USD Technical Analysis
Recently, the Aussie Dollar made a few attempts to clear the 0.7765 resistance zone against the US Dollar. The AUD/USD pair failed to gain momentum and it started a major decline below 0.7750.
It broke the 0.7700 support level and settled well below the 50 hourly simple moving average. The pair even broke the 0.7675 support level and extended its decline. It traded as low as 0.7644 on FXOpen and it is currently consolidating losses.
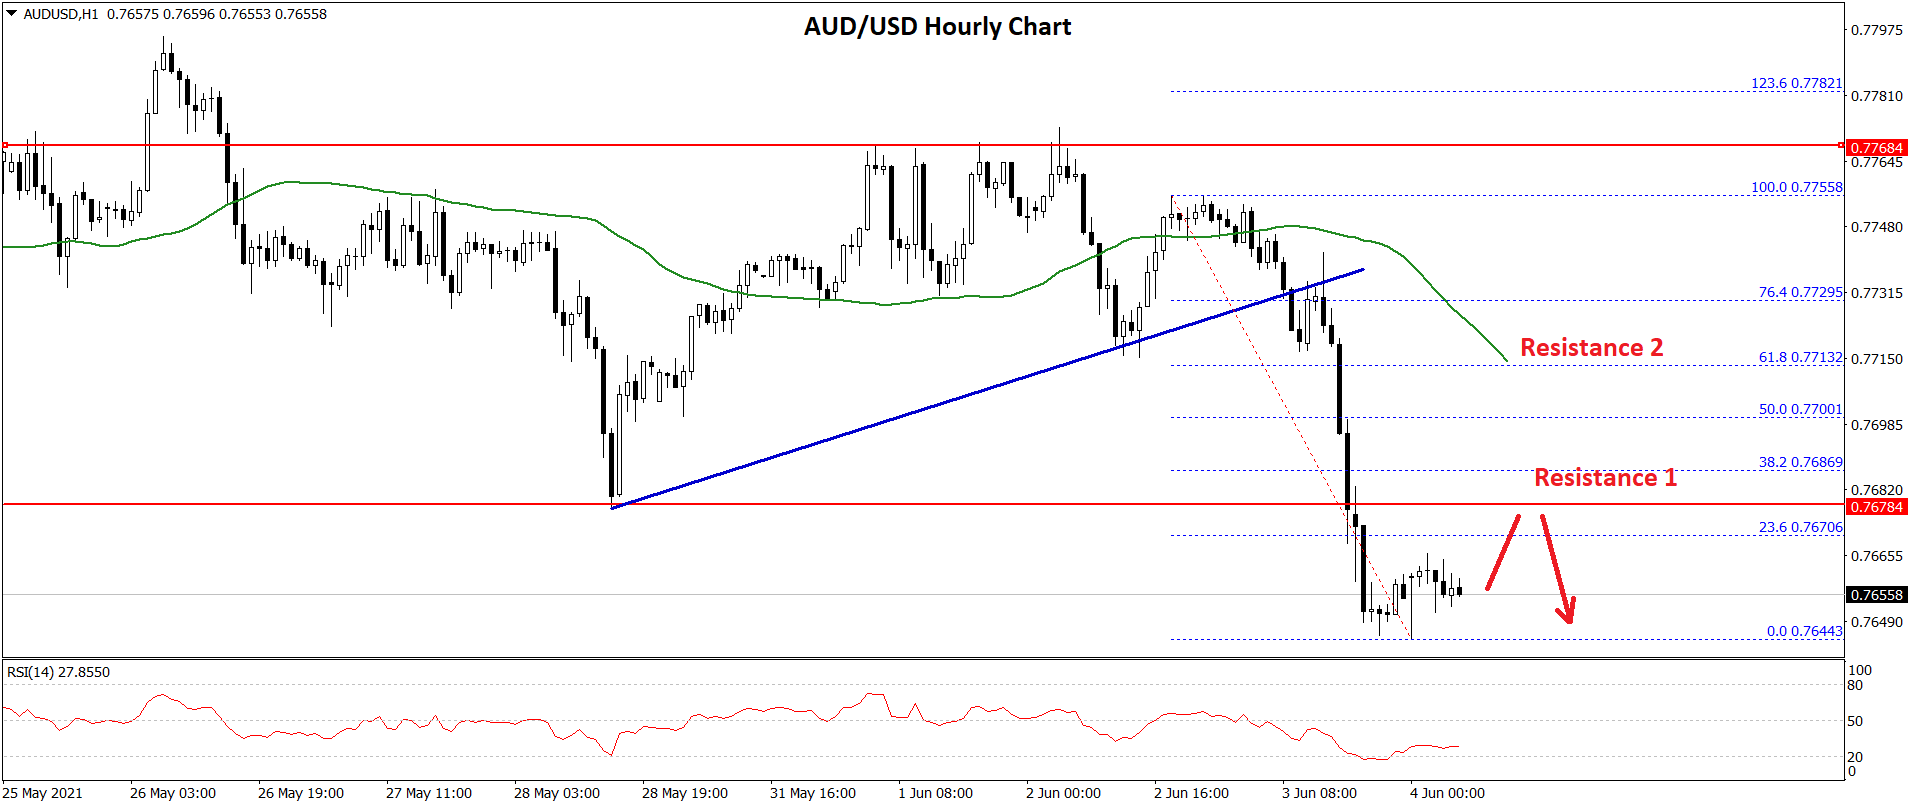
An initial resistance on the upside is near the 0.7670 level. It is near the 23.6% Fib retracement level of the recent decline from the 0.7755 high to 0.7644 low.
The first major resistance is near the 0.7675 level (the recent breakdown zone). The next major resistance is near the 0.7700 level. It is close to the 50% Fib retracement level of the recent decline from the 0.7755 high to 0.7644 low.
Any more gains could lead the pair towards the 0.7715 level and the 50 hourly simple moving average. Conversely, the pair could further decline below the 0.7650 support zone.
The next major support is near the 0.7640 level. If there is a downside break below the 0.7640 level, the pair could extend its decline towards the 0.7580 level.
NZD/USD Technical Analysis
The New Zealand Dollar also followed a similar path and declined after it failed to clear the 0.7280 resistance against the US Dollar. The NZD/USD pair broke the 0.7220 support zone to move into a short-term bearish zone.
There was a break below the 0.7200 support zone and the 50 hourly simple moving average. The pair even broke 0.7150 and tested the 0.7125 support zone.
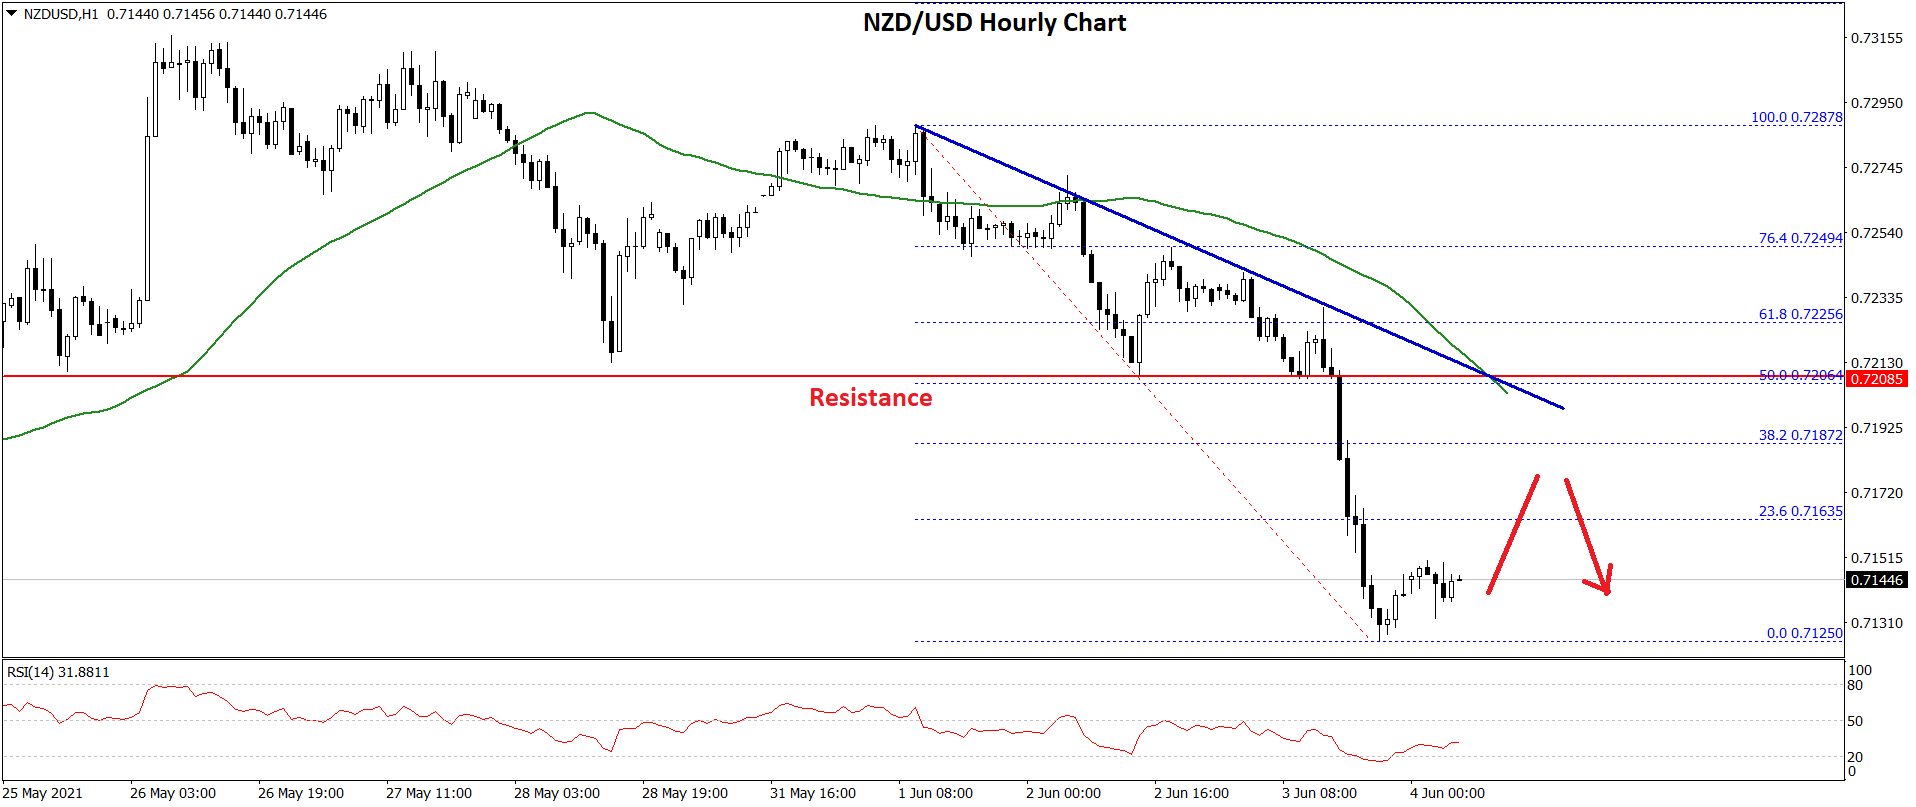
A low is formed near 0.7125 and the pair is now consolidating losses. An initial resistance is near the 0.7165 level. It is near the 23.6% Fib retracement level of the recent decline from the 0.7287 high to 0.7125 low.
The first major resistance for the bulls is near the 0.7200 level. and the 50 hourly simple moving average. There is also a key bearish trend line forming with resistance near 0.7200 on the hourly chart of NZD/USD.
The trend line is close to the 50% Fib retracement level of the recent decline from the 0.7287 high to 0.7125 low. A clear upside break above the trend line resistance and the 50 hourly SMA could open the doors for a decent increase towards the 0.7250 level. The next major resistance is near the 0.7280 level.
Conversely, the pair could extend its decline low the 0.7125 support. If NZD/USD breaks the 0.7125 low, it is likely to decline towards the 0.7080 level.
This forecast represents FXOpen Markets Limited opinion only, it should not be construed as an offer, invitation or recommendation in respect to FXOpen Markets Limited products and services or as financial advice.
Trade over 50 forex markets 24 hours a day with FXOpen. Take advantage of low commissions, deep liquidity, and spreads from 0.0 pips. Open your FXOpen account now or learn more about trading forex with FXOpen.
This article represents the opinion of the Companies operating under the FXOpen brand only. It is not to be construed as an offer, solicitation, or recommendation with respect to products and services provided by the Companies operating under the FXOpen brand, nor is it to be considered financial advice.
Latest from Forex Analysis
Latest articles

Is There the Best Time to Trade Stock CFDs?
If you ask experienced traders, many will say that they trade on certain days or at certain times of the day. Their choice is determined by the market dynamics, volatility, and liquidity. It’s crucial to understand when the best

UnitedHealth (UNH) Share Price Surges after Strong Report
UnitedHealth shares surged Tuesday, rising more than 5% after the health care giant delivered stronger-than-expected first-quarter 2024 results:
→ earnings per share: actual = USD 6.91, expected = USD 6.61, last quarter = USD 6.16;
→ gross income: actual = USD 94.4

USD/JPY Analysis: Prospect of a Breakout of the Level of 155 Yen per Dollar
The USD/JPY rate has consistently reached new highs since 1990, approaching the psychological level of 155 yen per US dollar. The Japanese currency has already fallen about 9% against the dollar this year.
This is supported by Jerome Powell,