


FXOpen
AUD/USD struggled near the 0.7175 level and recently corrected below the 0.7140 support. NZD/USD also declined recently and broke the key 0.6750 and 0.6740 support levels.
Important Takeaways for AUD/USD and NZD/USD
- The Aussie Dollar topped near the 0.7174 level and declined recently against the US Dollar.
- There was a break below a crucial bullish trend line with support at 0.7125 on the hourly chart of AUD/USD.
- NZD/USD declined sharply after it failed to clear the 0.6775-0.6780 resistance area.
- There was a break below a major ascending channel with support at 0.6755 on the hourly chart.
AUD/USD Technical Analysis
There was a decent upward move this week above 0.7120 in the Aussie Dollar against the US Dollar. The AUD/USD pair traded close to the 0.7175 resistance level, where sellers emerged.
As a result, the pair started a downside correction below the 0.7150 support level. There was also a break below the key 0.7130 support plus there was a close below the 50 hourly simple moving average.
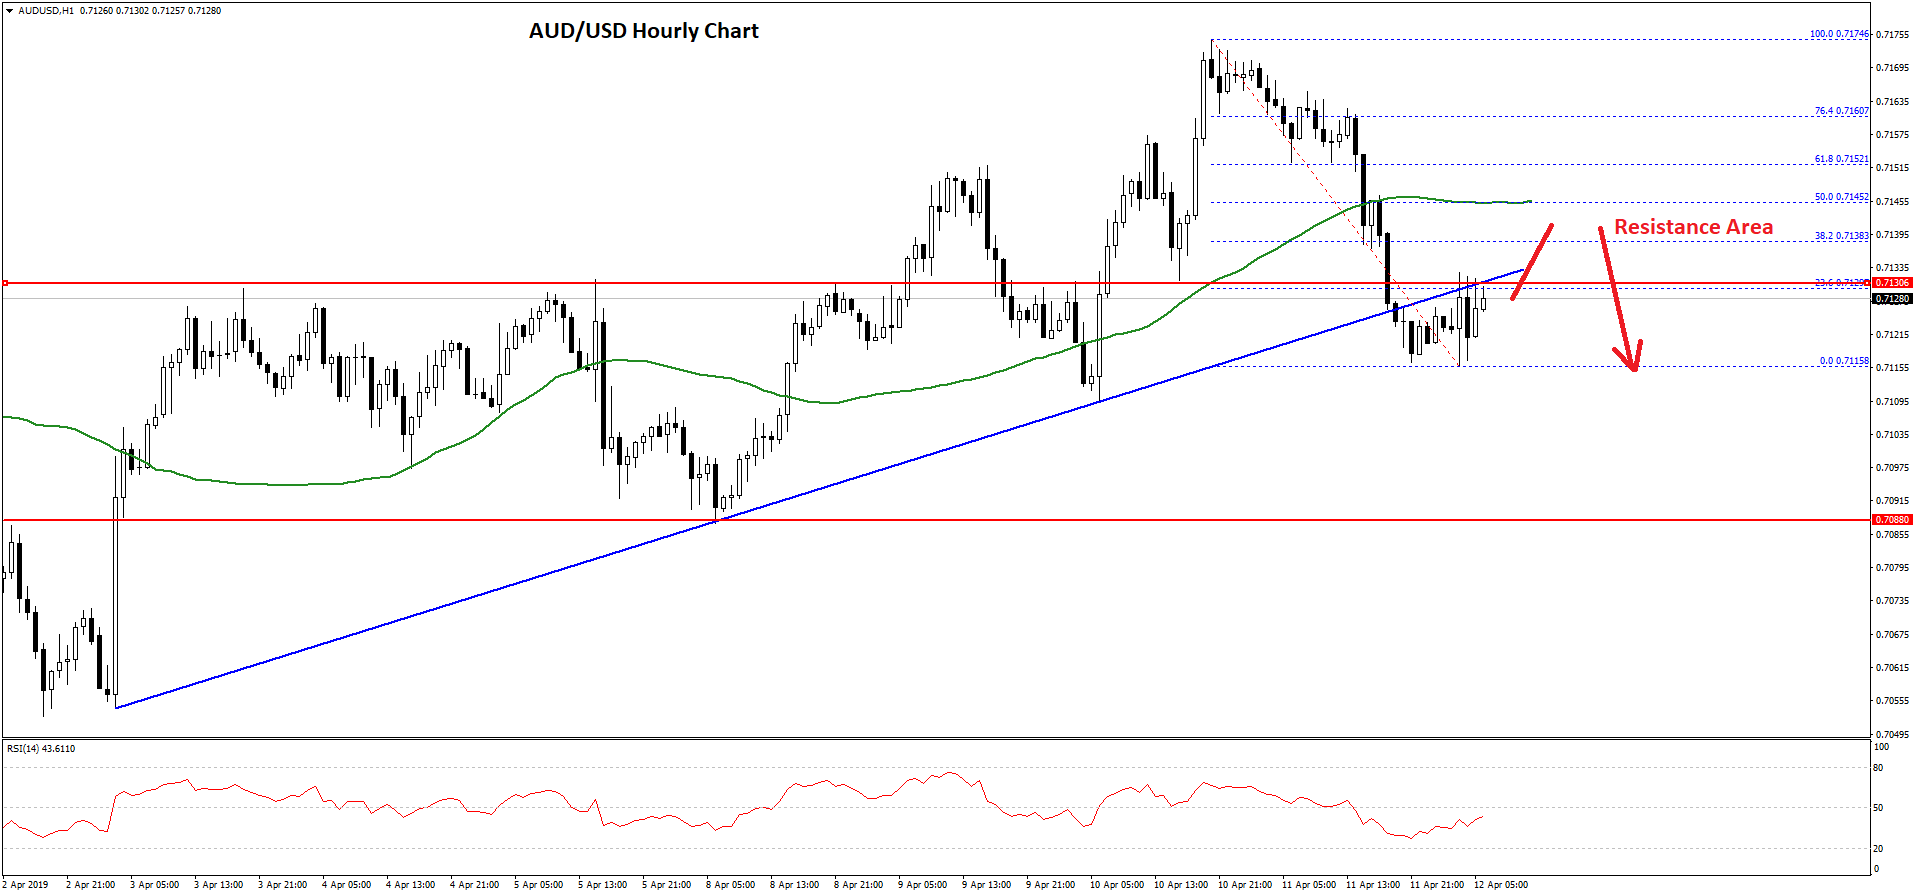
The pair traded as low as 0.7115 on FXOpen and it is currently consolidating losses. During the decline, there was a break below a crucial bullish trend line with support at 0.7125 on the hourly chart of AUD/USD.
The same trend line is currently acting as a resistance along with the 23.6% Fib retracement level of the recent decline from the 0.7174 high to 0.7115 low. However, the main resistance for buyers is near the 0.7150 level and the 50 hourly simple moving average.
The 50% Fib retracement level of the recent decline from the 0.7174 high to 0.7115 low is also near the 0.7145 level to act as a strong resistance.
Therefore, if the pair corrects higher, it is likely to face sellers near the 0.7145 and 0.7150 levels. On the downside, an initial support is at 0.7115, below which the price is likely to trade towards the 0.7100 support area in the near term.
NZD/USD Technical Analysis
The New Zealand Dollar followed a slow and steady uptrend and tested the 0.6775-0.6780 resistance area against the US Dollar. The NZD/USD pair struggled to clear the 0.6775 resistance and recently declined below the 0.6750 support level.
During the recent drop, the pair settled below the 0.6750 support and the 50 hourly simple moving average. More importantly, there was a break below a major ascending channel with support at 0.6755 on the hourly chart.
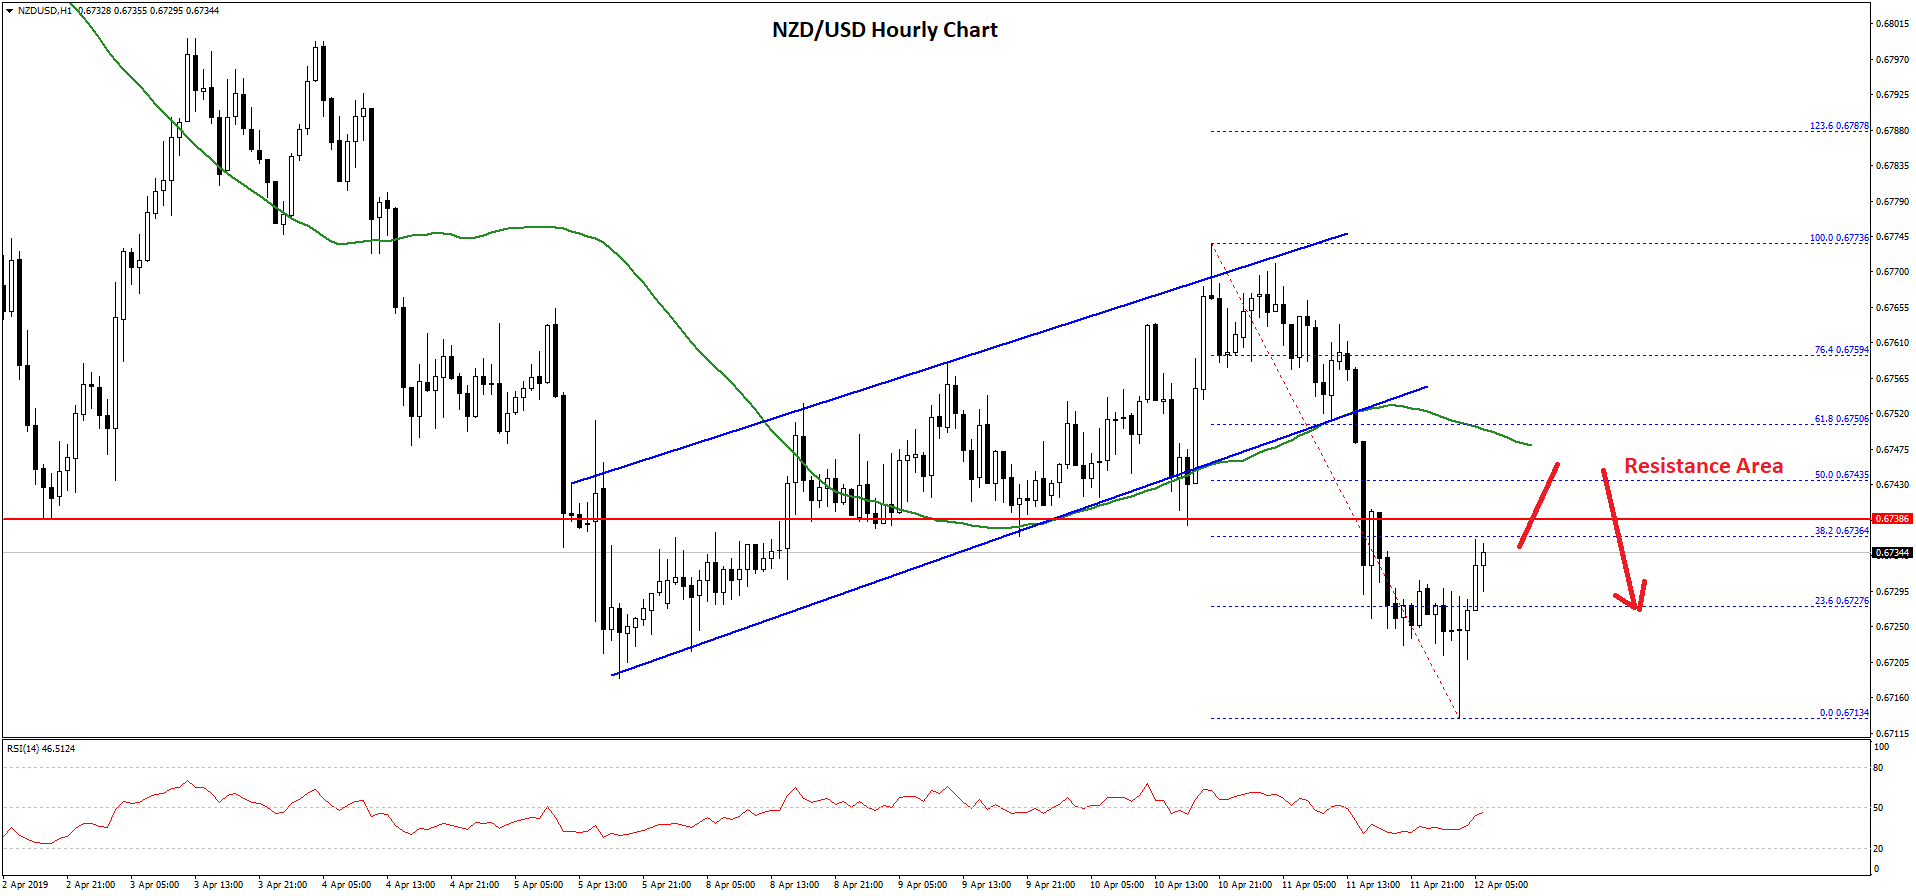
The pair declined sharply below the 0.6730 level and traded close to the 0.6710 level. A swing low was formed at 0.6713 and recently the pair corrected higher.
It traded above the 23.6% Fib retracement level of the recent decline from the 0.6773 high to 0.6713 low. However, there are many hurdles for buyers near the 0.6740 and 0.6750 resistance levels.
The 50 hourly simple moving average is positioned near the 0.7150 level along with the 50% Fib retracement level of the recent decline from the 0.6773 high to 0.6713 low.
Therefore, if there is a decent rebound, NZD/USD may perhaps face a strong resistance near the 0.6740-50 resistance area. On the downside, an initial support is near the 0.6725 level, below which there is a risk of an extended decline towards the 0.6700 support area.
Trade over 50 forex markets 24 hours a day with FXOpen. Take advantage of low commissions, deep liquidity, and spreads from 0.0 pips. Open your FXOpen account now or learn more about trading forex with FXOpen.
This article represents the opinion of the Companies operating under the FXOpen brand only. It is not to be construed as an offer, solicitation, or recommendation with respect to products and services provided by the Companies operating under the FXOpen brand, nor is it to be considered financial advice.
Latest from Forex Analysis
Latest articles

What Is a Darvas Box Theory and How Does It Work in Trading?
The Darvas Box Theory, pioneered by Nicolas Darvas in the 1950s, has transcended its stock market origins to become a valuable tool for forex traders. This method leverages specific price movements and patterns, known as the Darvas Box, to track

NFLX Stock Price Falls Despite Subscriber Growth
Yesterday, after the close of the main trading session on the stock market, Netflix reported to investors for the 1st quarter of 2024.
The report turned out better than expected:
→ earnings per share: actual = USD 5.28, forecast = USD 4.

Escalation Between Iran and Israel: How the Price of Brent Oil Reacts
On the night of Thursday into Friday, reports emerged that Israel had attacked Iran following Iran's attack on Israel over the weekend.
Let's remember that we wrote on Monday that after a 300 drone and missile attack on Israel over