


FXOpen

AUD/USD gained traction above 0.7100, but it seems to be struggling near the 0.7200 resistance. NZD/USD is showing positive signs and it could rise further above 0.6660.
Important Takeaways for AUD/USD and NZD/USD
- The Aussie Dollar started a decent rise above 0.7000, but struggled near 0.7200 against the US Dollar.
- There was a break below a major bullish trend line with support at 0.7165 on the hourly chart of AUD/USD.
- NZD/USD gained traction and climbed steadily above the 0.6600 resistance zone.
- There is a key bullish trend line forming with support near 0.6610 on the hourly chart of NZD/USD.
AUD/USD Technical Analysis
The Aussie Dollar started a steady rise from the 0.7000 support zone against the US Dollar. The AUD/USD pair broke a few major hurdles near 0.7100 and 0.7120 to move into a positive zone.
The pair gained pace above the 0.7150 level and the 50 hourly simple moving average. However, it failed to gain bullish momentum above the 0.7200 resistance level. A high is formed near 0.7209 on FXOpen recently and it is currently correcting lower.
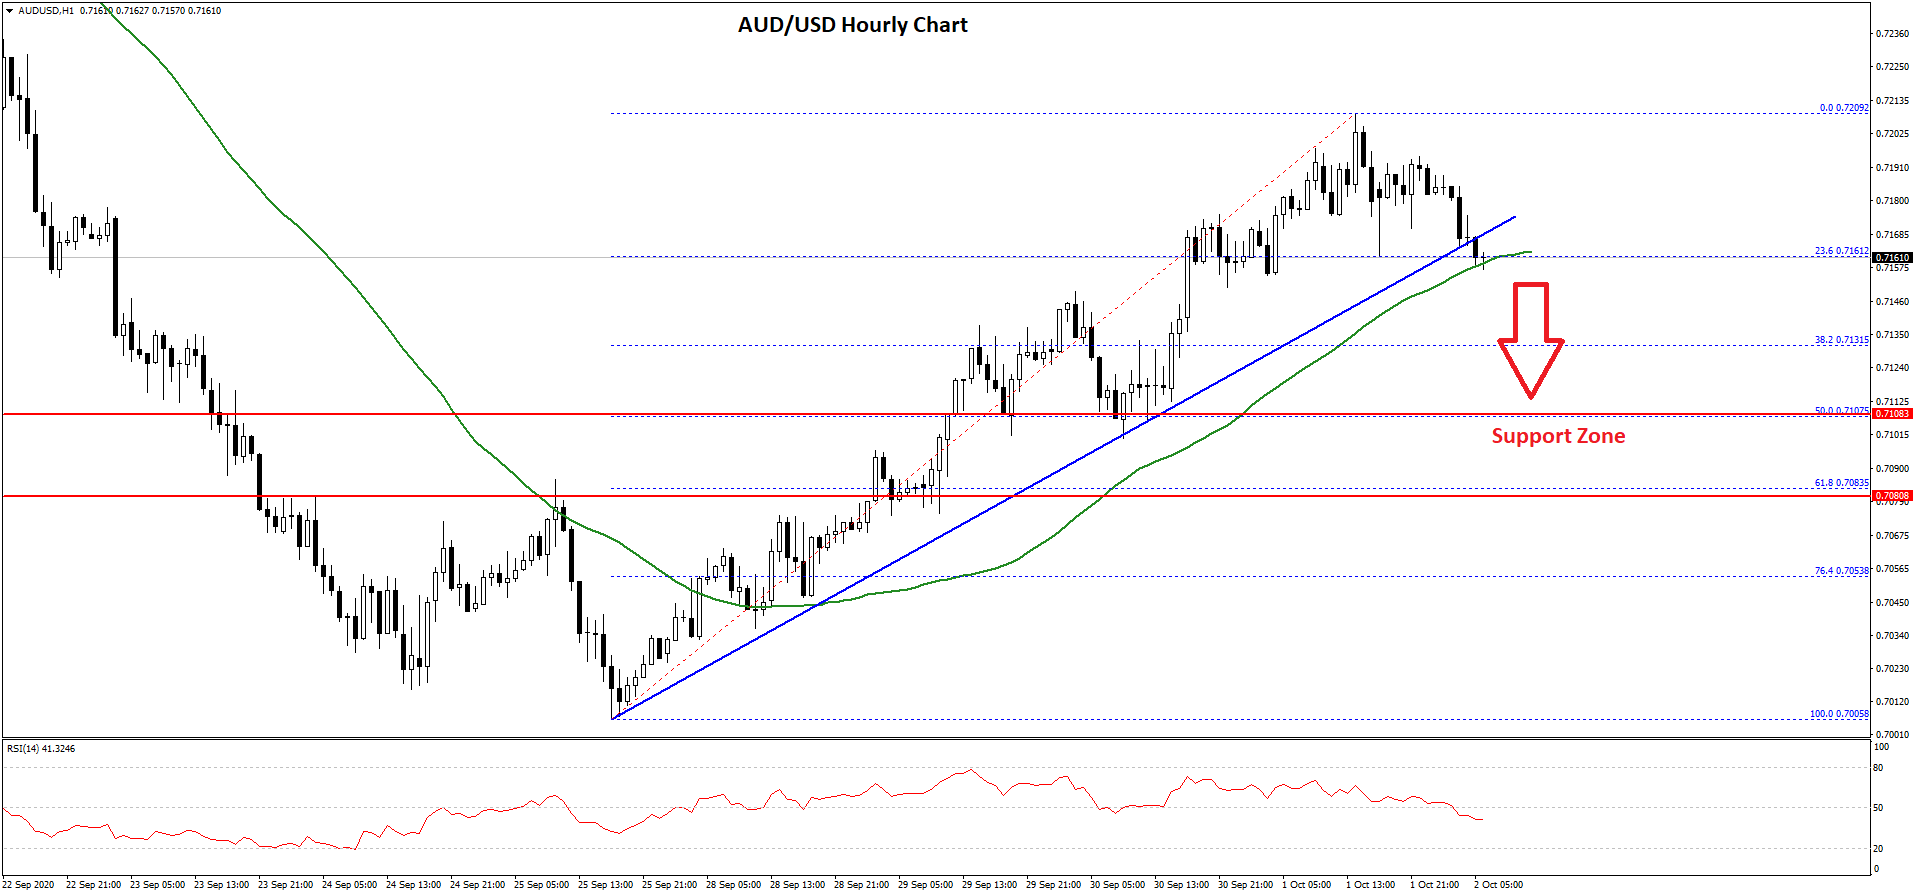
There was a break below the 0.7180 support level. Moreover, there was a break below a major bullish trend line with support at 0.7165 on the hourly chart of AUD/USD.
The pair is currently testing the 23.6% Fib retracement level of the upward move from the 0.7005 low to 0.7209 high, and the 50 hourly simple moving average. If there is a close below the 50 hourly simple moving average, the pair could continue to move down towards the 0.7150 support.
The next major support is near the 0.7100 level. It is close to the previous breakout zone, plus the 50% Fib retracement level of the upward move from the 0.7005 low to 0.7209 high.
On the upside, the pair is facing a major challenge near the 0.7200 level. If there is a proper close above the 0.7200 level, the pair could resume its upward move towards the 0.7250 and 0.7260 levels in the near term.
NZD/USD Technical Analysis
The New Zealand Dollar also followed a similar pattern and climbed higher nicely from the 0.6525 support zone against the US Dollar. The NZD/USD pair traded higher and broke many hurdles near the 0.6600 level.
The pair even surpassed the 0.6640 resistance and settled above the 50 hourly simple moving average. A high is formed near 0.6656 and the pair is currently consolidating gains.
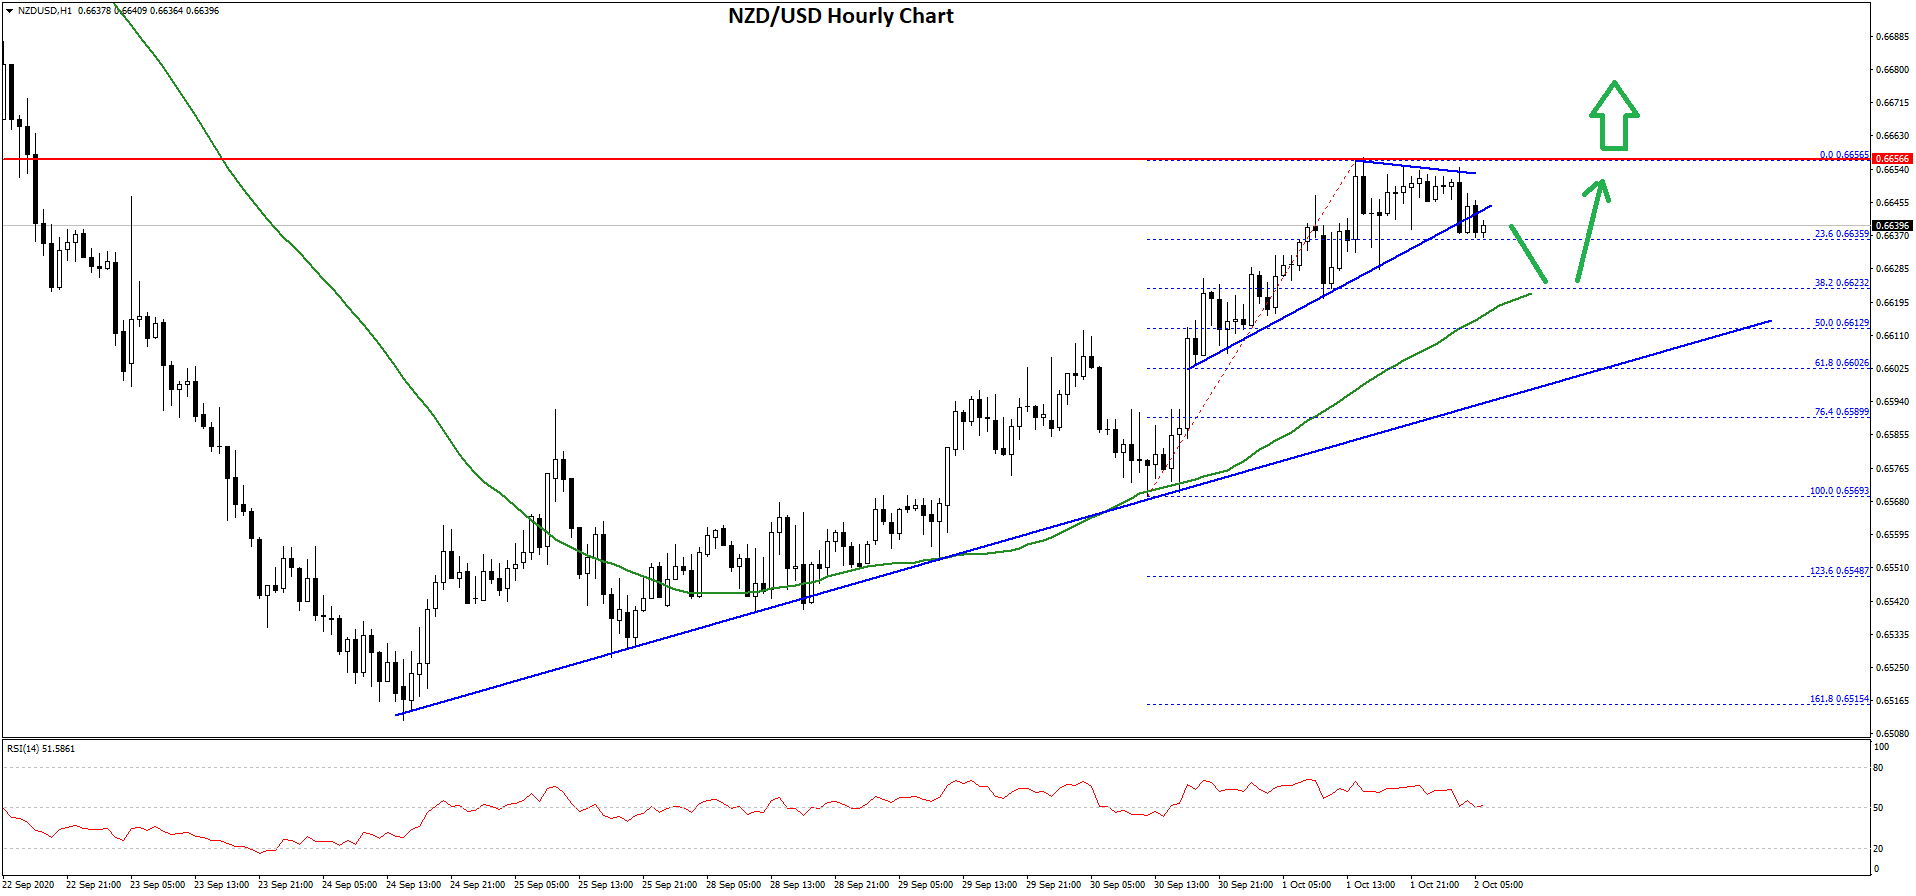
It is trading just below a short-term contracting triangle with support near 0.6645 on the hourly chart. An immediate support is near the 0.6640 level or the 23.6% Fib retracement level of the upward move from the 0.6569 swing low to 0.6656 high.
The main support on the downside is near the 0.6610 level. There is also a key bullish trend line forming with support near 0.6610 on the same chart of NZD/USD.
The trend line coincides with the 50% Fib retracement level of the upward move from the 0.6569 swing low to 0.6656 high. If there is a downside break below the trend line support and 0.6600, the pair could move into a bearish zone.
Conversely, the pair is likely to continue higher above the 0.6660 resistance zone. The next major resistance is near the 0.6680 level, above which it could test the 0.6700 zone.
Trade over 50 forex markets 24 hours a day with FXOpen. Take advantage of low commissions, deep liquidity, and spreads from 0.0 pips. Open your FXOpen account now or learn more about trading forex with FXOpen.
This article represents the opinion of the Companies operating under the FXOpen brand only. It is not to be construed as an offer, solicitation, or recommendation with respect to products and services provided by the Companies operating under the FXOpen brand, nor is it to be considered financial advice.
Latest from Forex Analysis
Latest articles

Google Share Price Rose Post-market to a New All-time Record
Yesterday, after the close of the main trading session, a report on activities for the 1st quarter of Alphabet Inc. (Google's parent company) was published. The report was strong, exceeding investors' expectations.
→ Quarterly EPS = USD 1.89 (expected = USD 1.

S&P 500 Rebounds after Negative GDP News
Data released yesterday showed US GDP growth slowed to 1.6% in the first quarter of the year. According to ForexFactory: forecast = 2.2%, past value = 2.4%.
Reaction to the news sent the S&P 500 mini stock

GBP/USD And USD/CAD Daily Chart Outlook
GBP/USD is attempting a recovery wave from 1.2300. USD/CAD is consolidating and might aim for a move above the 1.3760 resistance zone.
Important Takeaways for GBP/USD and USD/CAD Analysis Today
· The British Pound started