


FXOpen

AUD/USD is under a lot of pressure below the 0.6850 and 0.6820 support levels. Conversely, NZD/USD is climbing higher and it could even surpass the 0.6400 resistance area.
Important Takeaways for AUD/USD and NZD/USD
- The Aussie Dollar is trading in a bearish zone below the 0.6820 support against the US Dollar.
- There is a major bearish trend line forming with resistance near 0.6815 on the hourly chart of AUD/USD.
- NZD/USD is showing positive signs and it seems like it could rise above 0.6400 and 0.6420.
- There is a key bullish trend line forming with support near 0.6370 on the hourly chart of NZD/USD.
AUD/USD Technical Analysis
In the past few days, there was a steady decline in the Aussie Dollar from well above the 0.6850 support against the US Dollar. The AUD/USD pair broke a couple of important hurdles near 0.6820 to start a downtrend.
The decline was such that the pair settled below the 0.6820 level and the 50 hourly simple moving average. Finally, the pair traded below the 0.6800 level and traded to a new weekly low at 0.6769.
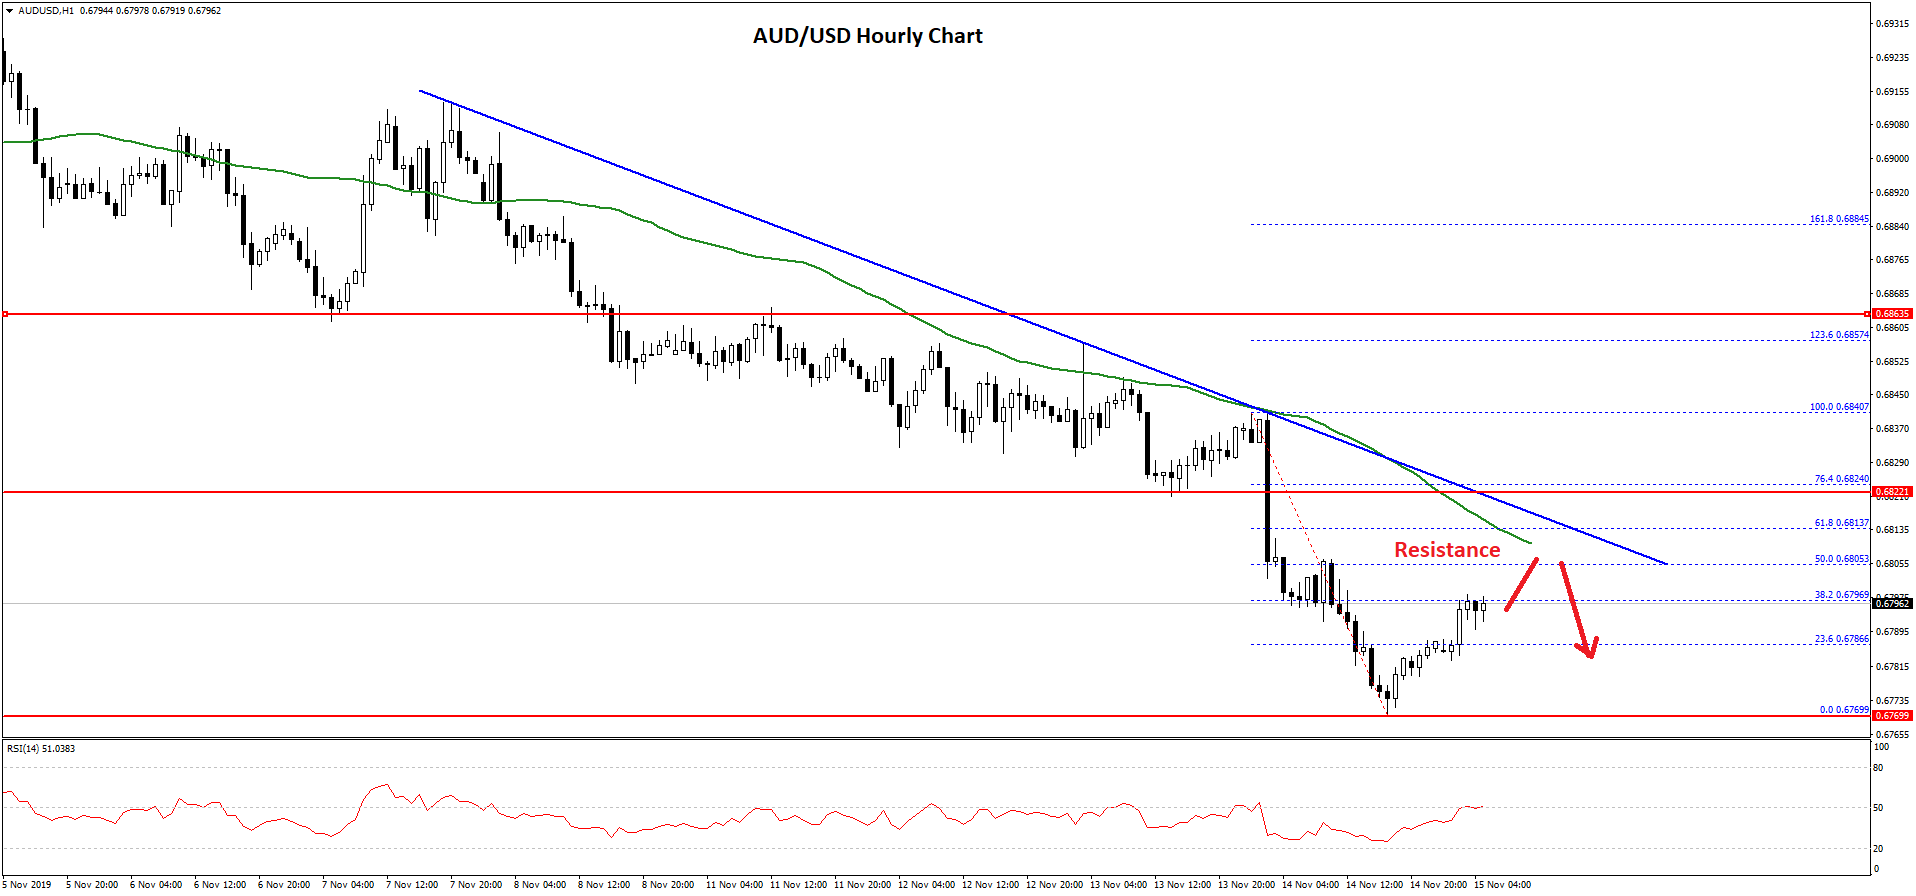
It is currently correcting above the 0.6780 level. Moreover, there was a break above the 23.6% Fib retracement level of the recent decline from the 0.6840 high to 0.6769 low.
However, there are many resistances on the upside near the 0.6815 and 0.6820 levels. Moreover, there is a major bearish trend line forming with resistance near 0.6815 on the hourly chart of AUD/USD.
The trend line coincides with the 50% Fib retracement level of the recent decline from the 0.6840 high to 0.6769 low. Besides, the 50 hourly simple moving average is also positioned near the 0.6815 level to act as a strong resistance.
Therefore, the price must break the 0.6815 and 0.6820 resistance levels to continue higher. On the downside, an initial support is near the 0.6780 level. If there is a clear break below the 0.6780 support, there is a risk of an extended decline below the 0.6760 and 0.6750 support levels.
NZD/USD Technical Analysis
The New Zealand Dollar remained well bid above the 0.6340 support area against the US Dollar. The NZD/USD pair started a decent increase above the 0.6400 level.
However, the pair failed to climb above the 0.6420 resistance and recently corrected lower below the 50 hourly simple moving average. The pair declined below the 0.6400 level and tested the 0.6360 support area.
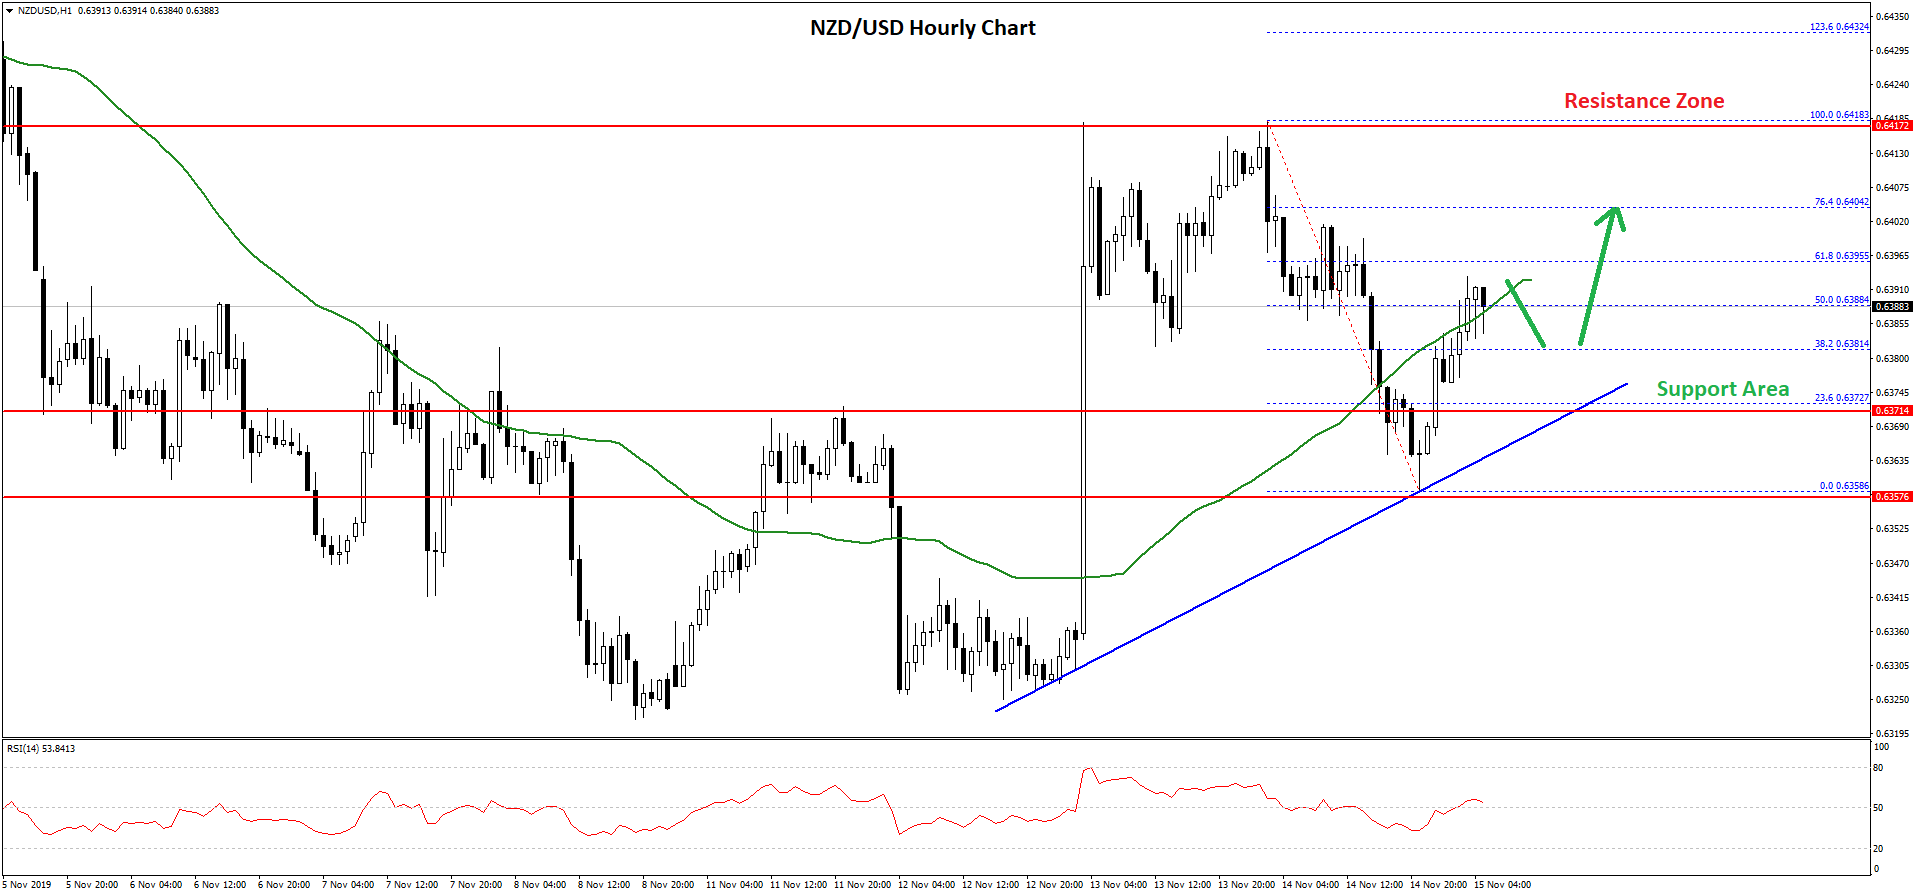
A low was formed near the 0.6358 level and the pair is currently climbing higher. It broke the 0.6380 resistance area and the 50 hourly simple moving average.
Besides, the pair is now trading just above the 50% Fib retracement level of the recent decline from the 0.6418 high to 0.6358 low. On the upside, there are many resistances, starting with the 0.6400 area.
Moreover, the 61.8% Fib retracement level of the recent decline from the 0.6418 high to 0.6358 low might also act as a resistance.
The main resistance is near the 0.6420 level, above which NZD/USD is likely to climb towards the 0.6450 and 0.6460 levels. On the downside, there is a strong support forming near the 0.6370 level.
More importantly, there is a key bullish trend line forming with support near 0.6370 on the hourly chart of NZD/USD. Therefore, only a close below 0.6360 could start a major decline towards 0.6320.
Trade over 50 forex markets 24 hours a day with FXOpen. Take advantage of low commissions, deep liquidity, and spreads from 0.0 pips. Open your FXOpen account now or learn more about trading forex with FXOpen.
This article represents the opinion of the Companies operating under the FXOpen brand only. It is not to be construed as an offer, solicitation, or recommendation with respect to products and services provided by the Companies operating under the FXOpen brand, nor is it to be considered financial advice.
Latest from Forex Analysis
Latest articles

Anchored VWAP and How You Can Use It in Forex Trading
In the world of forex trading, understanding the nuanced tools at your disposal can significantly enhance decision-making processes. One such sophisticated tool is the Anchored Volume-Weighted Average Price (Anchored VWAP), which refines the standard VWAP by allowing traders to set

META Share Price Collapses after Publication of Quarterly Report
Just yesterday, META's stock price closed at USD 493.50, up approximately 40% since the start of 2024 and up nearly 300% since the start of 2023.
However, following the release of Meta's quarterly report, its shares plummeted to USD

USD/JPY Analysis: The Rate Exceeds The Level of 155 Yen Per US Dollar
Today, the price of USD/JPY once again renewed its 34-year high, exceeding the level of 155 yen per dollar, which put pressure on the current authorities.
According to Reuters, officials are trying to maintain calm in the market.
"We