


FXOpen
AUD/USD declined sharply and broke the 0.7450 support before starting an upside correction. Similarly, NZD/USD dropped heavily towards 0.6880. Both pairs are currently correcting higher and are facing major resistances.
Important Takeaways for AUD/USD and NZD/USD
- The Aussie Dollar fell below important supports at 0.7500 and 0.7450 before starting a correction.
- AUD/USD broke a major connecting bearish trend line with resistance at 0.7380 to start a recovery.
- NZD/USD is also recovering and is approaching a major resistance near 0.6920.
- The New Zealand Westpac Consumer Confidence in Q2 2018 declined from 111.2 to 108.6.
AUD/USD Technical Analysis
The Aussie Dollar started a major bearish wave from well above the 0.7600 against the US Dollar. The AUD/USD pair declined and broke a few important supports such as 0.7500 and 0.7450 to move into a bearish zone.
The pair even broke the 0.7400 handle and traded towards 0.7350. A low was formed at 0.7345 before an upside correction was initiated. The pair moved higher and broke the 23.6% Fib retracement level of the last decline from the 0.7480 high to 0.7347 low.
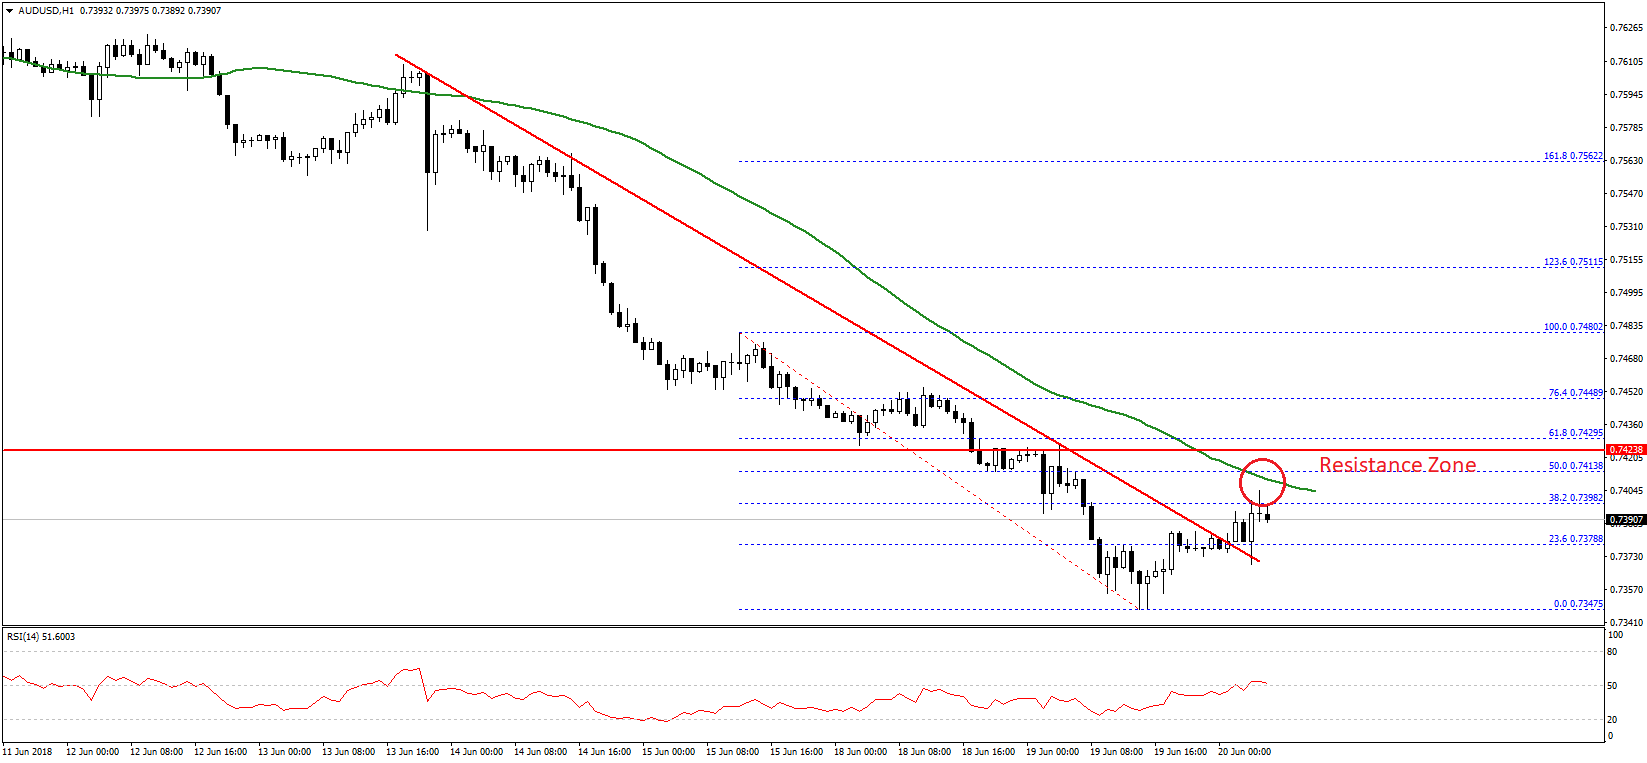
Moreover, the pair broke a major connecting bearish trend line with resistance at 0.7380 on the hourly chart. However, there are many resistances on the upside near the 0.7400/10 zone and the 50 hourly simple moving average.
More importantly, the 50% Fib retracement level of the last decline from the 0.7480 high to 0.7347 low is around 0.7410 to act as a barrier for buyers. A successful break above the 0.7410 and 0.7420 resistance levels are needed for more recoveries towards 0.7500 in the near term.
On the flip side, a failure to move past 0.7410 may perhaps resume the downtrend. Supports are seen near 0.7380 and 0.7350.
NZD/USD Technical Analysis
The New Zealand Dollar also followed the Aussie Dollar and started a bearish wave from the 0.7040 level against the US Dollar. The NZD/USD pair dropped heavily and broke the 0.7000 and 0.6950 support levels.
There was even a close below the 0.6920 pivot level and the 50 hourly simple moving average. The pair traded as low as 0.6885 before starting an upside correction. It moved above the 23.6% Fib retracement level of the last drop from the 0.6943 high to 0.6885 low.
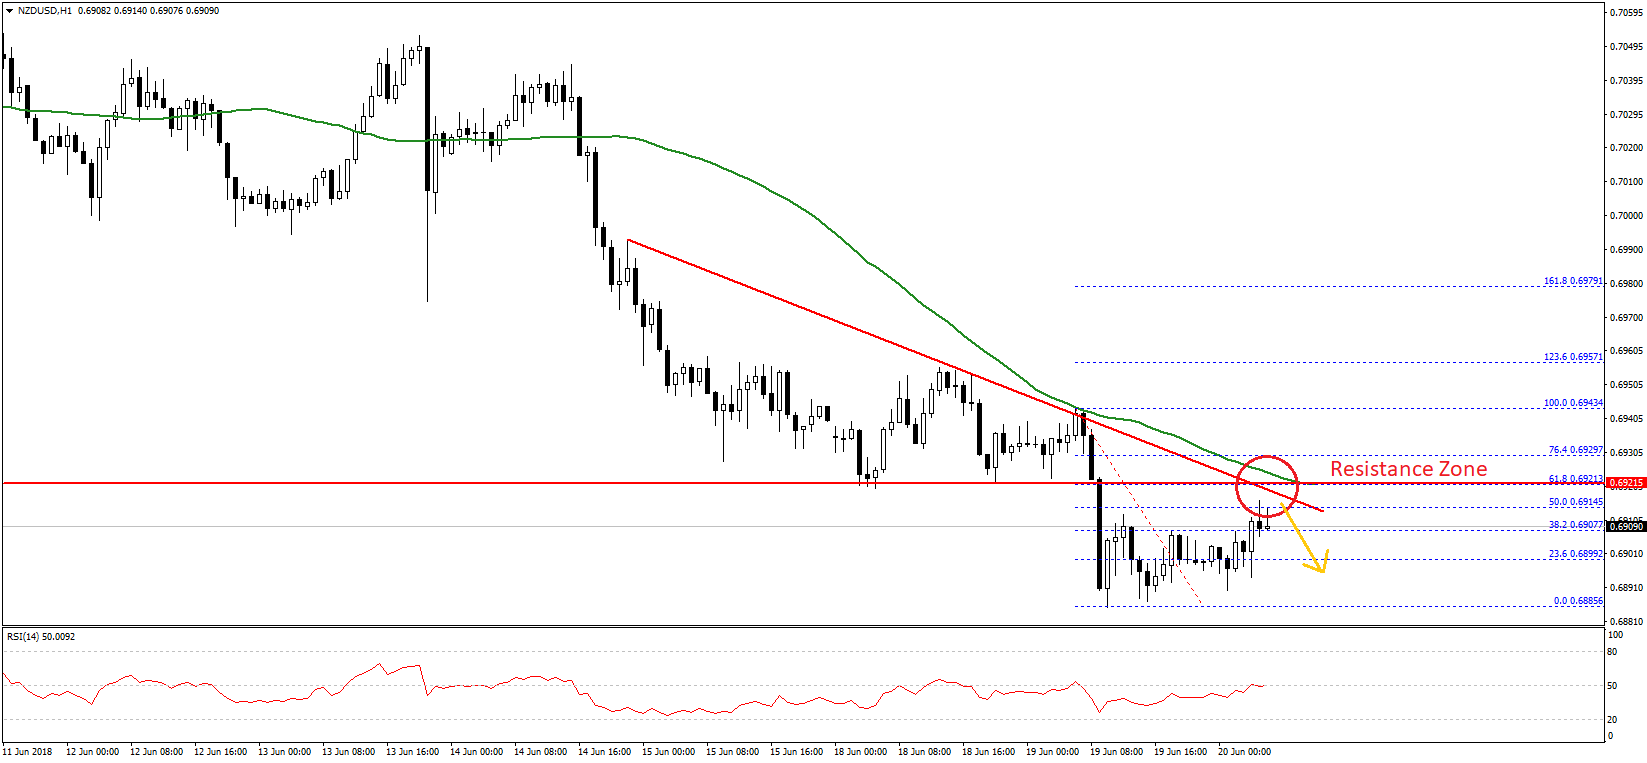
However, the pair is facing a lot of barriers near the 0.6920 resistance zone. Moreover, there is a bearish trend line in place with resistance at 0.6918 on the hourly chart. The same trend line is positioned with the 50 hourly SMA and the 50% Fib retracement level of the last drop from the 0.6943 high to 0.6885 low.
Therefore, a break and close above 0.6920 is needed for an upsides extension. If not, NZD/USD could decline once again and retest the 0.6880 area in the short term.
Fundamentally, the New Zealand Westpac Consumer Confidence for Q2 2018 was released by Westpac New Zealand. The market was looking for no major change from the last reading of 111.2.
However, the outcome was on the lower side as there was a decline in the Westpac Consumer Confidence from 111.2 to 108.6. The actual did not impact the NZD/USD pair, but it may perhaps cap more upsides in the near term.
Trade over 50 forex markets 24 hours a day with FXOpen. Take advantage of low commissions, deep liquidity, and spreads from 0.0 pips. Open your FXOpen account now or learn more about trading forex with FXOpen.
This article represents the opinion of the Companies operating under the FXOpen brand only. It is not to be construed as an offer, solicitation, or recommendation with respect to products and services provided by the Companies operating under the FXOpen brand, nor is it to be considered financial advice.
Latest from Forex Analysis
Latest articles

What Order Imbalance Is and How To Use It in a Trading Strategy
Understanding the nuances of order imbalances is key for traders looking to navigate the ebb and flow of asset prices. Order imbalances provide a clear window into the supply and demand dynamics at play, offering strategic insights. This article delves

XAU/USD Gold Price Reaches an Important Resistance Zone
The XAU/USD gold chart today indicates that the historical record price of the metal is above USD 2,400 per ounce.
In addition to fears of a new round of inflation due to rising commodity prices, geopolitical tensions are

What Is a Break of Structure and How Can You Trade It?
In the ever-evolving world of Smart Money Concept (SMC) trading, a nuanced understanding of market dynamics is indispensable. This article explores the concept of Break of Structure (BOS), how to identify it, and its implications for trading strategies, setting traders