


FXOpen
Yesterday bitcoin made another attempt to break out and end the current downtrend. It was unsuccessful and the coin proceeded to drop by $346 dollars from the highs. Litecoin followed big brother lower declining by 6 percent today.
Bitcoin Drops From Highs
Bitcoin hit a high of $6,806 yesterday, only $34 dollars away from the previous swing high at $6,840 dollars. As noted in our last article, we needed a breakout above this level to end the downtrend. As that didn’t occur, BTC/USD remains in a downtrend on the daily charts.
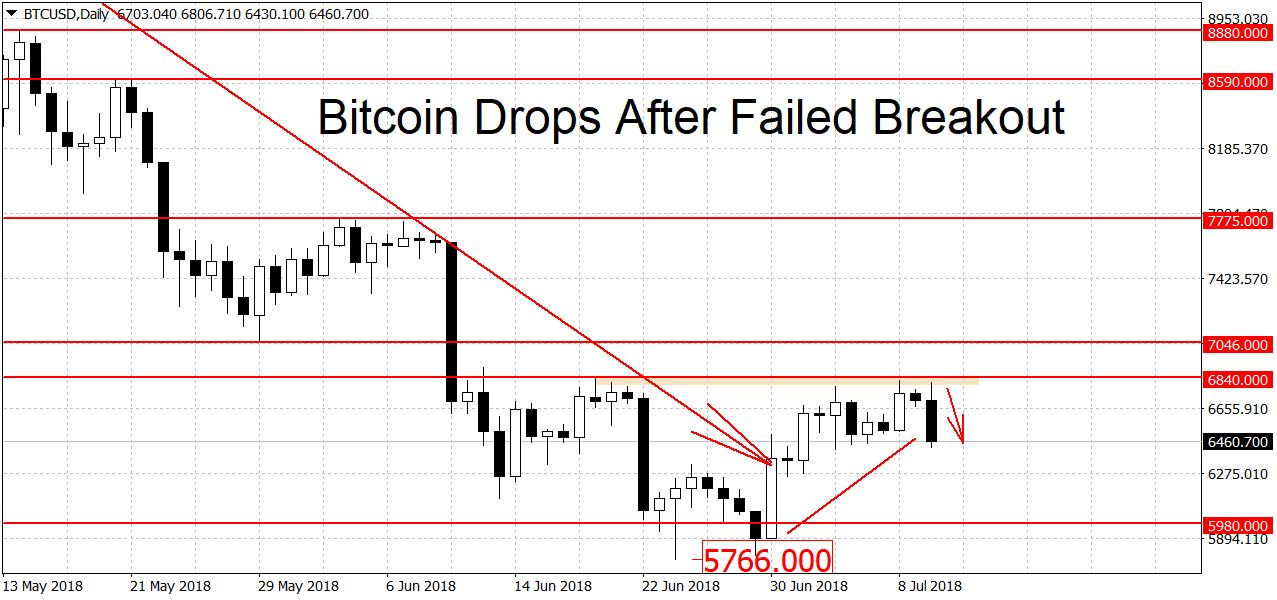
The $6,840 dollars figure remains to be the important swing high. A breakout above it would both end the downtrend and trigger a new uptrend in prices. We are currently quoted at $6,460 dollars, down 3.6 percent on the day.
Below there’s some support at this year’s low of $5,766 dollars. A stronger level however can be found at the $5,000 round figure. Besides being a major round figure, $5,000 was also a notable swing high last year that stalled the bubble by one month. It’s unlikely that this support will be broken on the first try. When and if $5,000 breaks the losses could intensify.
On the upside there’s strong resistance at $6,840 dollars followed by a weaker level at the previous swing low of $7,046 dollars. Resistance higher up can be found at the $7,775 swing high. This is followed by more levels at $8,590 and 8,880 dollars. The $10,000 round figure is another notable resistance level. A breakout above could lead to more gains. There’s no change in trend on the longer-term charts, the weeklies are in a downtrend while the monthlies are still looking bullish.
Litecoin Follows BTC Lower
As usual litecoin, as most of the crypto market, followed BTC lower. The crypto is trading at $76.20 dollars at the moment, down by $4.80 today or around 6 percent.
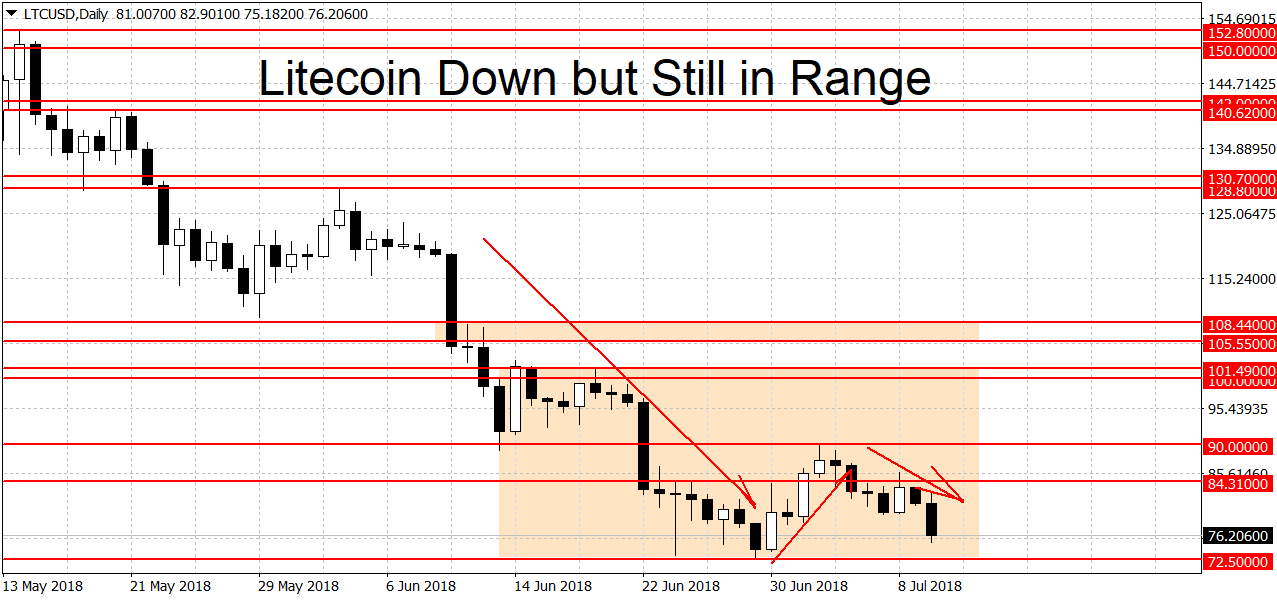
Despite the losses LTC/USD remains in a range as you can see on the chart below. We need a breakout above $101.49 or below $72.50 to start a new trend. As things stand right now a break to the downside is more likely. Below $72.50 the next major level of support is around $50 dollars. Here we have the 2013 high at $48.40 dollars coupled with the $50 round figure. A clean break below $48.40 could lead to more losses below. This doesn’t mean that the ‘coast is clear’ for shorts between $72.50 and $50 dollars as some support is likely to emerge in this 30 percent gap.
On the upside after $101.49 there’s strong resistance in the $105 – $109 area. This was the low in 2018 for over five months until the June breakdown. A clearing of this resistance area could lead to more gains. On the longer-term charts litecoin is bearish on the weeklies but bullish on the monthlies.
MetaTrader BTC trading on FXOpen Crypto accounts.
FXOpen offers the world's most popular cryptocurrency CFDs*, including Bitcoin and Ethereum. Floating spreads, 1:2 leverage — at your service. Open your trading account now or learn more about crypto CFD trading with FXOpen.
*At FXOpen UK and FXOpen AU, Cryptocurrency CFDs are only available for trading by those clients categorised as Professional clients under FCA Rules and Professional clients under ASIC Rules respectively. They are not available for trading by Retail clients.
This article represents the opinion of the Companies operating under the FXOpen brand only. It is not to be construed as an offer, solicitation, or recommendation with respect to products and services provided by the Companies operating under the FXOpen brand, nor is it to be considered financial advice.
Latest from Cryptocurrencies
Latest articles

What Order Imbalance Is and How To Use It in a Trading Strategy
Understanding the nuances of order imbalances is key for traders looking to navigate the ebb and flow of asset prices. Order imbalances provide a clear window into the supply and demand dynamics at play, offering strategic insights. This article delves

XAU/USD Gold Price Reaches an Important Resistance Zone
The XAU/USD gold chart today indicates that the historical record price of the metal is above USD 2,400 per ounce.
In addition to fears of a new round of inflation due to rising commodity prices, geopolitical tensions are

What Is a Break of Structure and How Can You Trade It?
In the ever-evolving world of Smart Money Concept (SMC) trading, a nuanced understanding of market dynamics is indispensable. This article explores the concept of Break of Structure (BOS), how to identify it, and its implications for trading strategies, setting traders