


FXOpen
Bitcoin prices fell almost 21 percent after the People’s Bank of China banned ICOs. This was enough to end the trend on the daily charts. Litecoin, on the other hand, remains in rally mode despite suffering large losses as well.
Bitcoin Falls 21 Percent on ICO Ban
Bitcoin fell from the $4,960 high reached a few days ago to hit a low of $3,930 today. This is a drop of $1,030 or 21%. We are currently trading at $4,247 after a sizeable recovery from the lows. The main reason behind the drop was news that the PBOC banned ICOs in the country. More on this developing story HERE. To read a brief explanation on ICOs please click HERE. There are rumors that the PBOC might take further action on ‘virtual currencies’ soon.
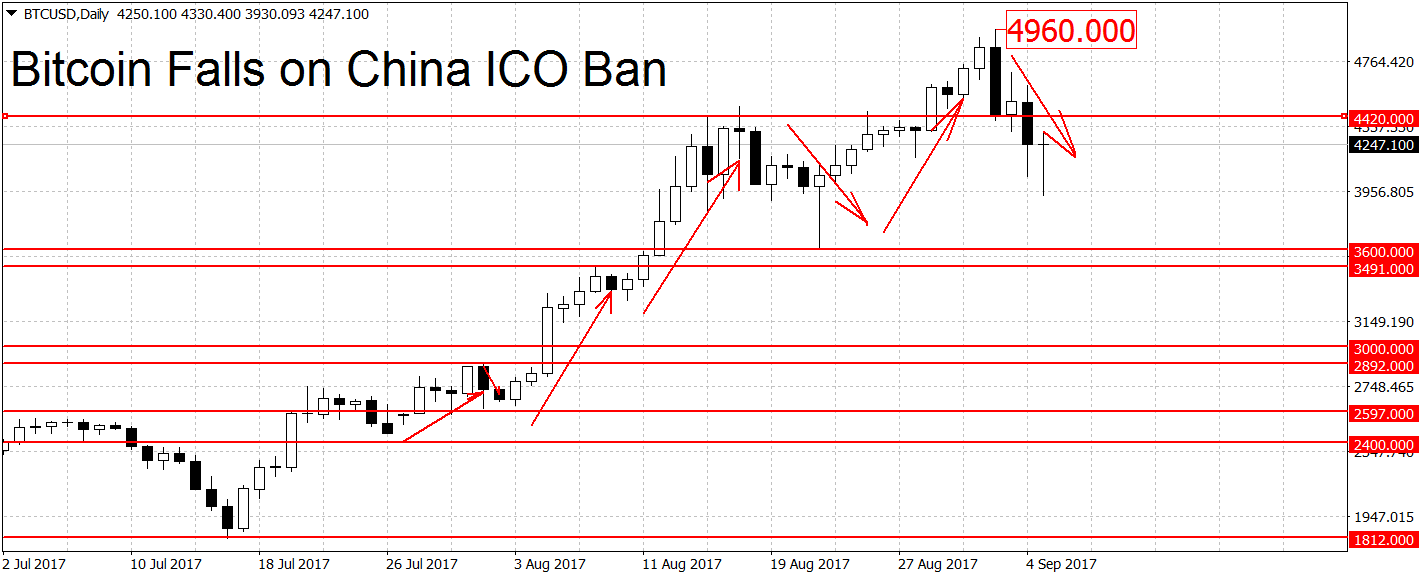
The large drop effectively ended the bullish trend on the daily charts. Today looks set to close as a ‘doji’ also known as the indecision candlestick. What happens in the next few days or weeks will decide the next direction for BTC/USD. A breakout above $5,000 would restart the rally. Slightly below here we have the all-time high at $4,960 dollars per coin. This level along with the $5,000 round figure should act as a strong resistance area.
On the way down we similarly find another support area around the $4,000 round figure, stretching from $4,000 to yesterday’s low at $3,930. A new downtrend (on daily) requires a break below the $3,600 swing low. Further down we have more support at the $3,500 round figure, closely followed by the $3,491 swing high. A clearing of this area could extend the losses for bitcoin. On the weekly and monthly charts, BTC is still in an uptrend.
More Gains for Litecoin
Litecoin hit a new all-time high of $93.60 on September 2nd. Then as the China ICO ban rumors started swirling around LTC/USD fell along with the rest of the market. Today a low of $60.55 was hit, a drop of $33.05 dollars from the highs. In percentage terms, this was a move of close to 37%.
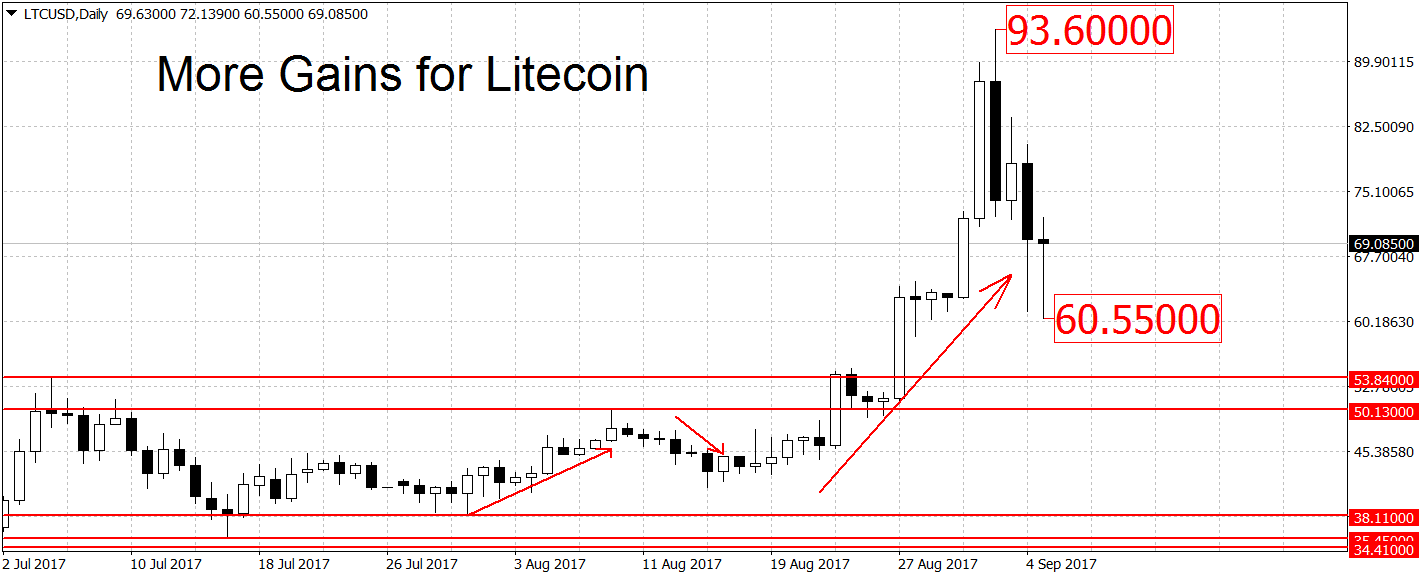
However, this wasn’t enough to end the rally on the daily charts. For that to happen the bears will have to push prices below the $50 round figure. Support above here can be found at the today’s low of $60.55. This is followed by the $60 round figure and the $58.52 swing low. A clearing of this area may open the door to the $50 handle. But like we said above, the daily trend will remain up until the $50 round figure gives way. On the longer-term weekly and monthly charts, LTC remains in a bullish trend.
If you look for a platform where you can trade bitcoin, learn more about FXOpen.
FXOpen offers the world's most popular cryptocurrency CFDs*, including Bitcoin and Ethereum. Floating spreads, 1:2 leverage — at your service. Open your trading account now or learn more about crypto CFD trading with FXOpen.
*At FXOpen UK and FXOpen AU, Cryptocurrency CFDs are only available for trading by those clients categorised as Professional clients under FCA Rules and Professional clients under ASIC Rules respectively. They are not available for trading by Retail clients.
This article represents the opinion of the Companies operating under the FXOpen brand only. It is not to be construed as an offer, solicitation, or recommendation with respect to products and services provided by the Companies operating under the FXOpen brand, nor is it to be considered financial advice.
Latest articles

Anchored VWAP and How You Can Use It in Forex Trading
In the world of forex trading, understanding the nuanced tools at your disposal can significantly enhance decision-making processes. One such sophisticated tool is the Anchored Volume-Weighted Average Price (Anchored VWAP), which refines the standard VWAP by allowing traders to set

META Share Price Collapses after Publication of Quarterly Report
Just yesterday, META's stock price closed at USD 493.50, up approximately 40% since the start of 2024 and up nearly 300% since the start of 2023.
However, following the release of Meta's quarterly report, its shares plummeted to USD

USD/JPY Analysis: The Rate Exceeds The Level of 155 Yen Per US Dollar
Today, the price of USD/JPY once again renewed its 34-year high, exceeding the level of 155 yen per dollar, which put pressure on the current authorities.
According to Reuters, officials are trying to maintain calm in the market.
"We