


FXOpen
Both bitcoin and litecoin made solid gains during the past week. Bitcoin is up by $505 dollars or 8% since last Tuesday while LTC is higher by $8.96 dollars or close to 9 percent.
Bitcoin Gains 8 Percent
Big brother bitcoin is up by over 8 percent. However, these gains weren’t enough to end the downtrend on the daily chart. For that to happen we need to see a breakout above $6,840 dollars per coin. A decisive break beyond $7,046 would start a new BTC rally.
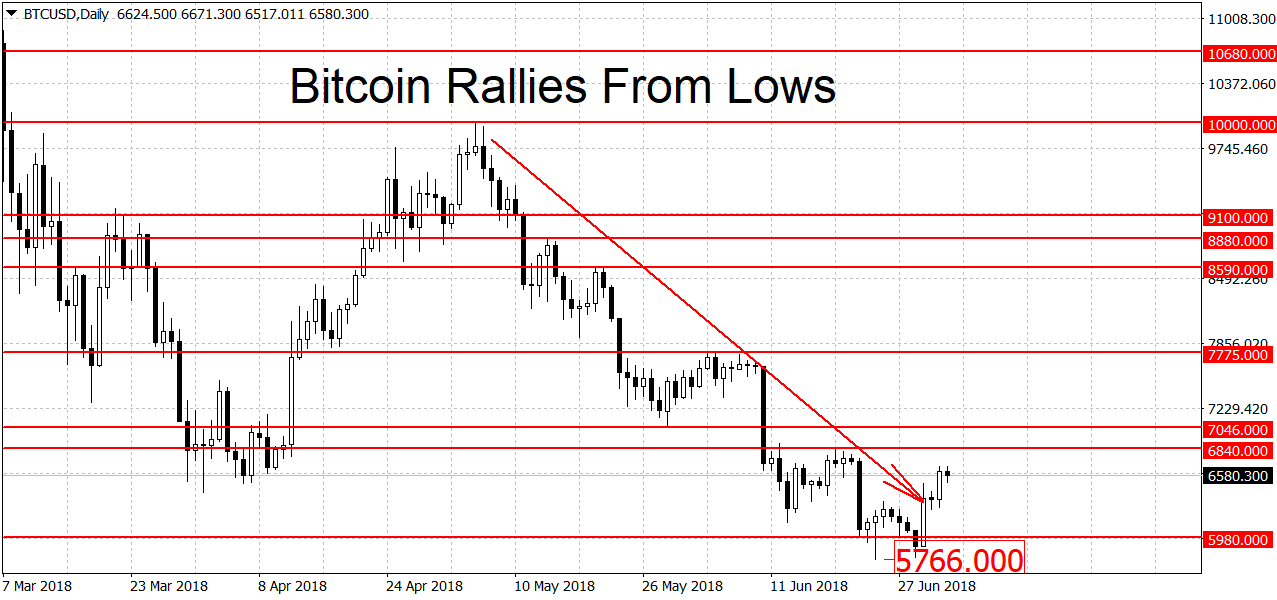
Resistance higher up can be found at the $7,775 swing high. This is followed by more levels at $8,590 and 8,880 dollars. The $10,000 round figure is another notable resistance level. A breakout above it could lead to an extended move up.
Below there’s weak support at this year’s low of $5,766 dollars. A stronger level is the $5,000 round figure. Besides being a major round figure, $5,000 was also a notable swing high last year. It’s unlikely that this support will be broken on the first try. However when and if $5,000 breaks the losses could intensify. There’s no change in trend on the longer-term charts either. The weekly charts are still in a downtrend while the monthlies are keeping the bullish bias.
Litecoin Ends Downtrend
The near 24% jump from lows was enough to push LTC/USD out of the downtrend. The altcoin is now back in range on the daily charts.
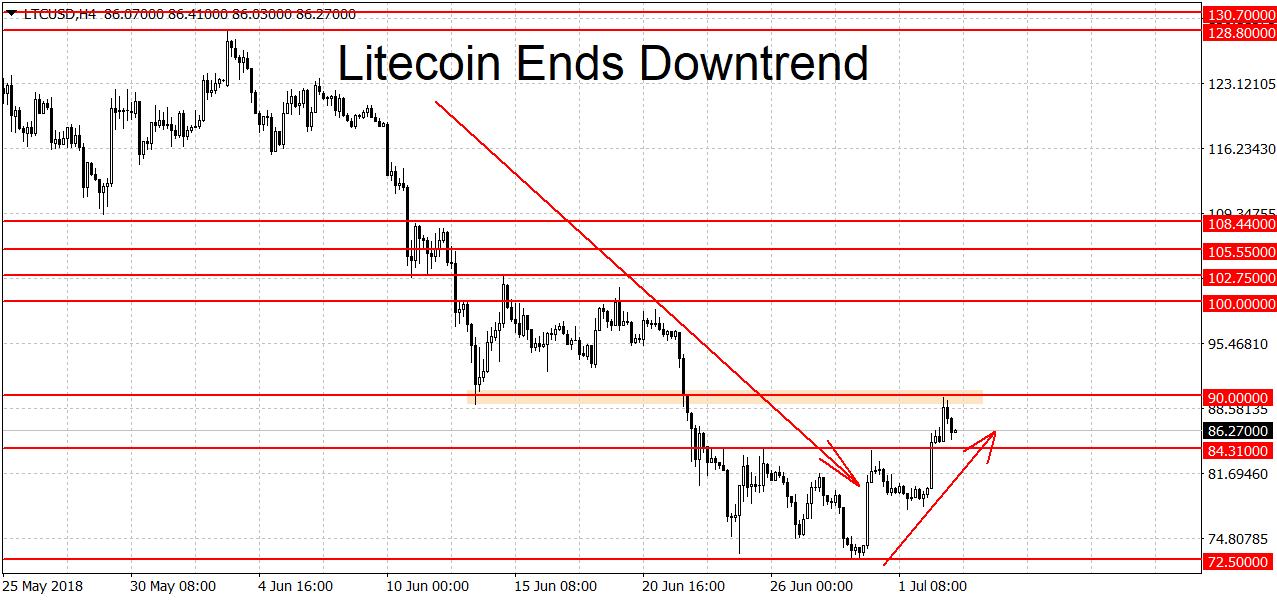
A breakdown below the 2018 low at $72.50 dollars would re-start the downtrend. Below this area of support, the next major level is around $50 dollars. Here we have the 2013 high at $48.40 dollars coupled with the $50 round figure. A clean break below $48.40 could lead to more losses below.
Above there’s some resistance around $90 dollars. But the bulls need a breakout above $102.75 to start a new rally in prices. Not far from here, the $105 – $109 area could be tough resistance. This was the low in 2018 for over five months until the June drop forced prices lower. A break of this area could lead to more gains.
Higher up there’s more resistance at $128.80 dollars, followed by the round figures at $140 and $150 dollars. Higher still we have the $152.80 swing high as another notable resistance. On the longer-term charts, LTC is in the same boat as BTC. The weekly charts are bearish while the monthlies are still clinging on to the bullish bias.
Open a Metatrader Crypto account with FXOpen.
FXOpen offers the world's most popular cryptocurrency CFDs*, including Bitcoin and Ethereum. Floating spreads, 1:2 leverage — at your service. Open your trading account now or learn more about crypto CFD trading with FXOpen.
*At FXOpen UK and FXOpen AU, Cryptocurrency CFDs are only available for trading by those clients categorised as Professional clients under FCA Rules and Professional clients under ASIC Rules respectively. They are not available for trading by Retail clients.
This article represents the opinion of the Companies operating under the FXOpen brand only. It is not to be construed as an offer, solicitation, or recommendation with respect to products and services provided by the Companies operating under the FXOpen brand, nor is it to be considered financial advice.
Latest articles

How to Identify and Trade Liquidity Grabs
Understanding the intricacies of market liquidity and the role of liquidity grabs can be crucial for optimising trading strategies. Liquidity grabs, creating rapid price movements, are a key component of Smart Money trading. This article explores how to identify these

What Is a Piercing Line Pattern, and How Can You Trade with It?
In the world of technical analysis, the piercing line pattern stands out as a solid indicator of potential market reversals. This article delves into the nuances of this two-candlestick pattern, exploring its formation, significance, and how traders can effectively leverage

London Calling! FTSE 100 Stocks Flying High Once Again
Back in 2021, which when looking at a physical calendar does not seem such a long time ago yet feels like an epoch ago when considering the changes in global economies and the capital markets since then, the FTSE 100