


FXOpen
Both Bitcoin and Litecoin are back in a downtrend after recent losses. Since our last update, BTC/USD declined by over $2,000 and is currently quoted at $8,290 dollars per coin. Litecoin is down by $30 dollars to $165 dollars.
Bitcoin Falls Over 20 Percent
Bitcoin has lost over 20 percent of its value during the last ten days. With the break below the $9,211 level, BTC re-entered a bear market on the daily charts. After that breakdown, we saw a substantial decline to $7,656 dollars yesterday. Since then prices bounced back a bit but this seems to be a dead-cat rally.
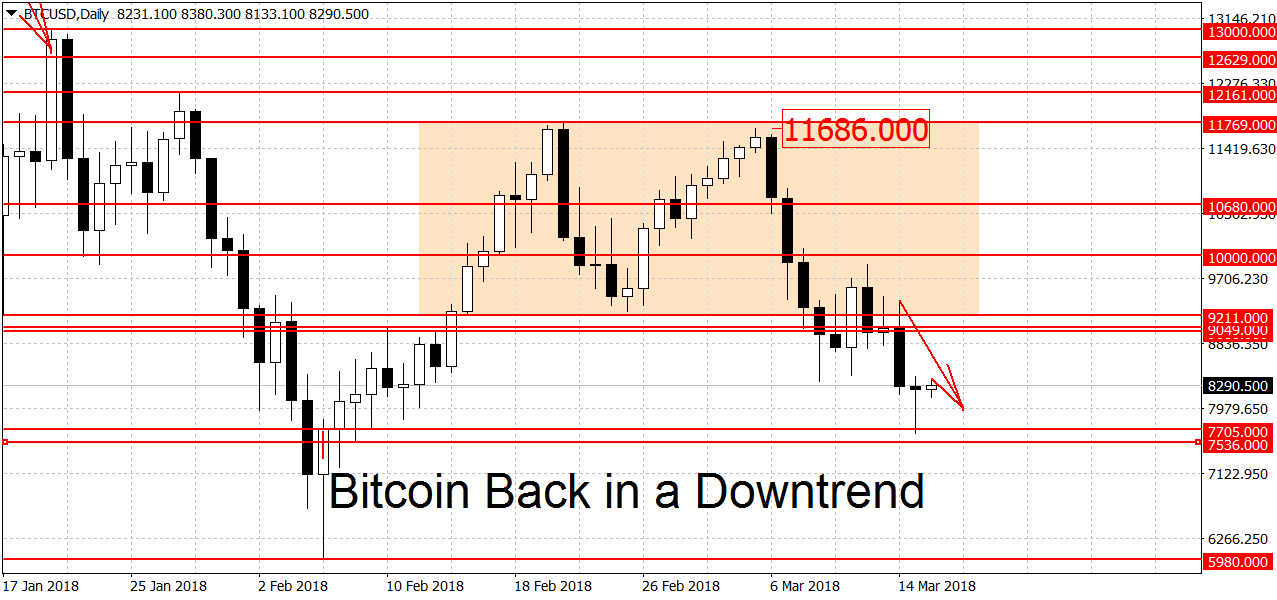
A breakout above $11,769 dollars is needed to end the current downtrend. A move above here would also turn the trend from down to up. Support on the way down can be found at $7,656 (weak) followed by the $7,536 swing low. Last month’s low at $5,980 is another notable support level. A break below here could lead to more losses. On the weekly charts, BTC/USD is range-bound. The monthlies are still keeping the bullish bias. But as we’ve said previously, an eventual change of trend on this time-frame could take many months.
Litecoin Falls by $30 Dollars
Litecoin fell by $30 dollars since our last update. Back then the altcoin was quoted at $195 dollars while currently prices are trading around $165 dollars.
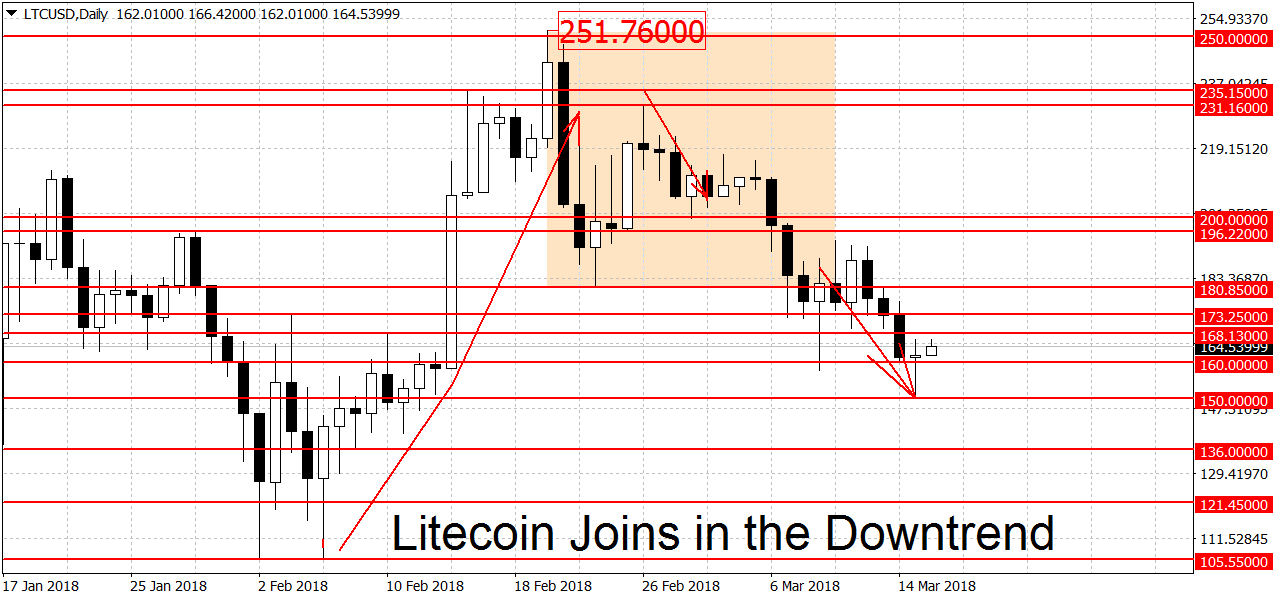
With the break below $180.85 dollars, LTC joined bitcoin in the downtrend. During the crypto sell-off yesterday a low of exactly $150 dollars was hit on FXOpen. From here a bounce transpired that took litecoin to a high of $166.24 dollars. We are currently quoted slightly below the highs at $164.54 dollars.
The altcoin will remain in a downtrend until the $231.16 swing high is taken out. A new rally requires a break of the $251.76 swing high as well. Below here we have weak resistance at $196.22 and the $200 round figure. Stronger levels can be found at the $250 round figure followed by last month’s high at $251.76 dollars per coin. A clean breakout above here could lead to more gains. Further up we have the $300 round figure and the all-time high at $370 dollars as another notable resistance level.
On the lower end, there’s strong support at $150 dollars. This is yesterday’s low as well as an important round figure for LTC/USD. A break below here could lead to more losses. On the longer-term weekly and monthly charts litecoin is looking slightly bullish.
Open a live Crypto bitcoin account and start cryptocurrency trading with FXOpen.
FXOpen offers the world's most popular cryptocurrency CFDs*, including Bitcoin and Ethereum. Floating spreads, 1:2 leverage — at your service. Open your trading account now or learn more about crypto CFD trading with FXOpen.
*At FXOpen UK and FXOpen AU, Cryptocurrency CFDs are only available for trading by those clients categorised as Professional clients under FCA Rules and Professional clients under ASIC Rules respectively. They are not available for trading by Retail clients.
This article represents the opinion of the Companies operating under the FXOpen brand only. It is not to be construed as an offer, solicitation, or recommendation with respect to products and services provided by the Companies operating under the FXOpen brand, nor is it to be considered financial advice.
Latest articles

Anchored VWAP and How You Can Use It in Forex Trading
In the world of forex trading, understanding the nuanced tools at your disposal can significantly enhance decision-making processes. One such sophisticated tool is the Anchored Volume-Weighted Average Price (Anchored VWAP), which refines the standard VWAP by allowing traders to set

META Share Price Collapses after Publication of Quarterly Report
Just yesterday, META's stock price closed at USD 493.50, up approximately 40% since the start of 2024 and up nearly 300% since the start of 2023.
However, following the release of Meta's quarterly report, its shares plummeted to USD

USD/JPY Analysis: The Rate Exceeds The Level of 155 Yen Per US Dollar
Today, the price of USD/JPY once again renewed its 34-year high, exceeding the level of 155 yen per dollar, which put pressure on the current authorities.
According to Reuters, officials are trying to maintain calm in the market.
"We