


FXOpen
The rally in both bitcoin and litecoin is stalling. One BTC is selling for $9,289 right now, down from $9,764 dollars last Tuesday. Litecoin is trading lower by $4 dollars to $157 per coin.
Bitcoin Rally Stalls
As noted above, the rally in BTC/USD is somewhat stalling. Prices topped out at $9,987 dollars five days ago and since then it’s been a slow ride down. Early this morning we dipped below the $9,000 round figure briefly but recovered quickly for a second time. However the bulls may not be so lucky the third time around, another retest may lead to a breakdown lower.
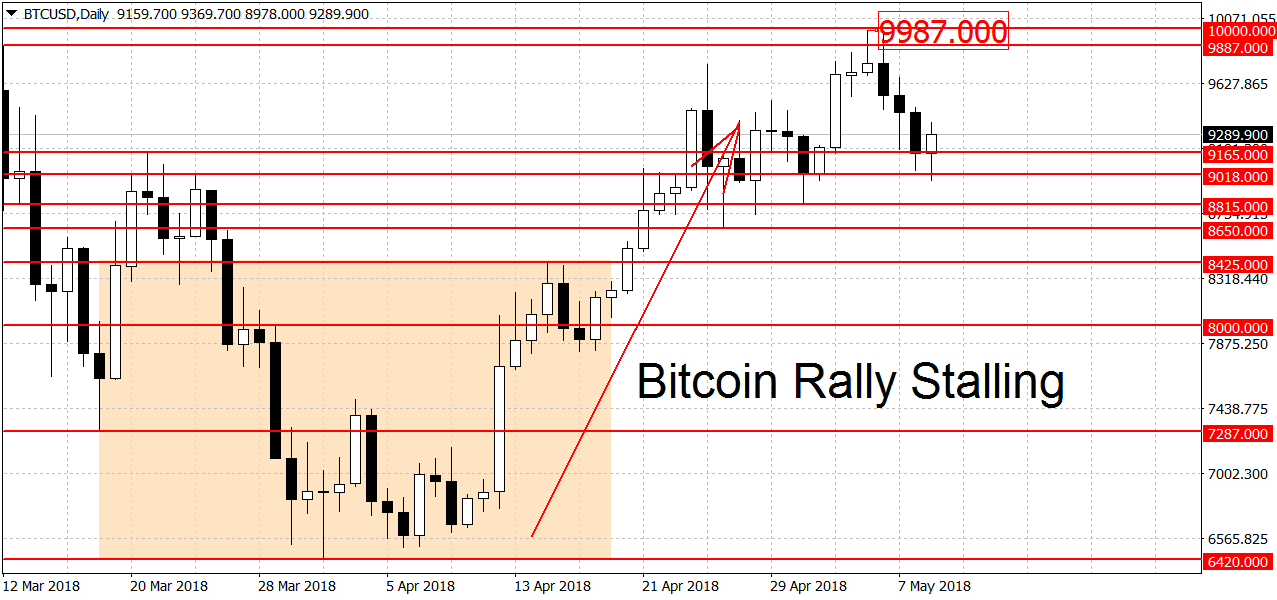
The potential trend-ending support stands at the $8,815 swing low although not far from here there’s more decent support at the $8,650 swing low. A new downtrend may commence on a decisive break below the $8,000 round figure. Further down there’s some support around the former swing low at $7,287 dollars.
But a stronger area to watch out for is the $6,420 to $6,600 range. This is where we bottomed out last time. This year’s low at $5,980 dollars is another notable level. A clearing of these support levels may open the door to the $5,000 round figure. There’s no change on the longer-term charts. Here the weekly is still range-bound with the monthly keeping a bullish bias.
Litecoin Down $4 Dollars
Litecoin is again following big brother, this time lower. Prices are quoted at $157 dollars right now, down by 2.5 percent in a week. The sentiment on the daily charts is similar to BTC/USD. The bullish trend remains but the momentum has been lacking during the past few days. Litecoin topped out at $184.74 dollars four days ago and it’s been drifting lower ever since.
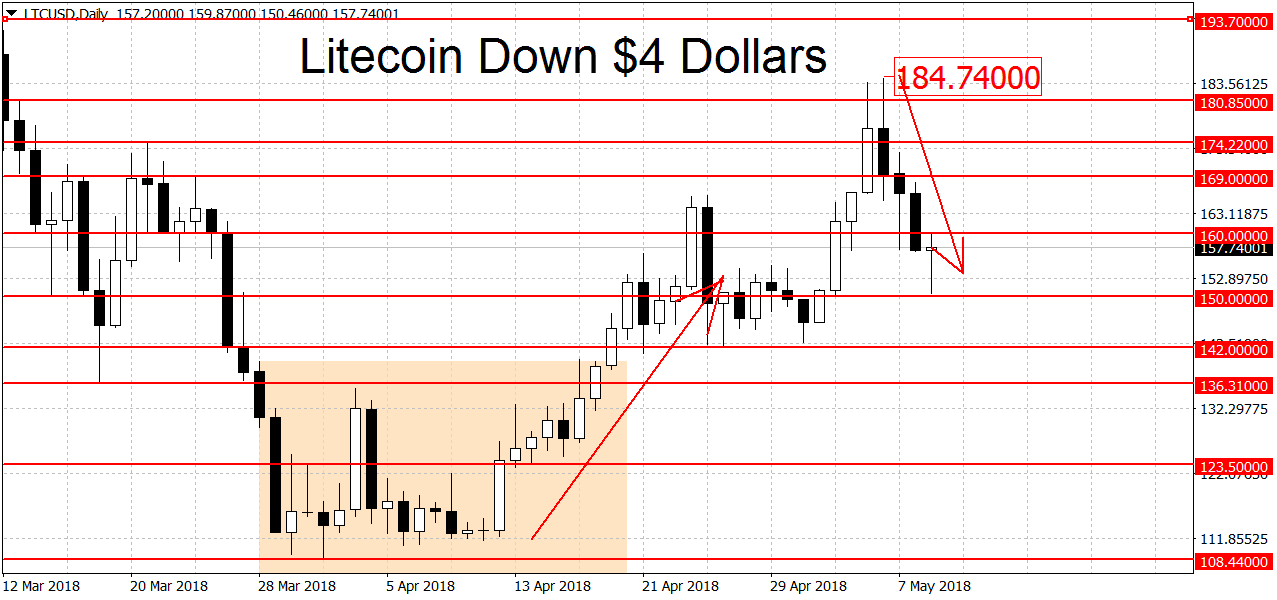
The bears need a break below the important $142 swing low to end the bullish trend. A clean break below the $136 figure could re-start the downtrend. Further down there’s more support at $123.50 followed by the the $108.44 swing low. The yearly low is quite close from here at $105.55 dollars, so some may wait until that milestone is taken out as well. Further down the $100 round figure may also act as weak support. On the longer-term weekly and monthly charts LTC/USD is still looking bullish.
Try fx bitcoin trading with FXOpen broker!
FXOpen offers the world's most popular cryptocurrency CFDs*, including Bitcoin and Ethereum. Floating spreads, 1:2 leverage — at your service. Open your trading account now or learn more about crypto CFD trading with FXOpen.
*At FXOpen UK and FXOpen AU, Cryptocurrency CFDs are only available for trading by those clients categorised as Professional clients under FCA Rules and Professional clients under ASIC Rules respectively. They are not available for trading by Retail clients.
This article represents the opinion of the Companies operating under the FXOpen brand only. It is not to be construed as an offer, solicitation, or recommendation with respect to products and services provided by the Companies operating under the FXOpen brand, nor is it to be considered financial advice.
Latest from Cryptocurrencies
Latest articles

What Order Imbalance Is and How To Use It in a Trading Strategy
Understanding the nuances of order imbalances is key for traders looking to navigate the ebb and flow of asset prices. Order imbalances provide a clear window into the supply and demand dynamics at play, offering strategic insights. This article delves

XAU/USD Gold Price Reaches an Important Resistance Zone
The XAU/USD gold chart today indicates that the historical record price of the metal is above USD 2,400 per ounce.
In addition to fears of a new round of inflation due to rising commodity prices, geopolitical tensions are

What Is a Break of Structure and How Can You Trade It?
In the ever-evolving world of Smart Money Concept (SMC) trading, a nuanced understanding of market dynamics is indispensable. This article explores the concept of Break of Structure (BOS), how to identify it, and its implications for trading strategies, setting traders