


FXOpen
Both bitcoin and litecoin have settled into large triangle patterns. The formations are ascending triangles, potentially signalling that more gains are on the way.
Bitcoin Settles in a Large Triangle Pattern
With the price action during the past seven days, bitcoin has settled firmly inside a large triangle. On the picture below you can see this formation. Prices peaked at $462.16 on April 26th and we’ve been rang-bound ever since, albeit with a slight bullish bias.
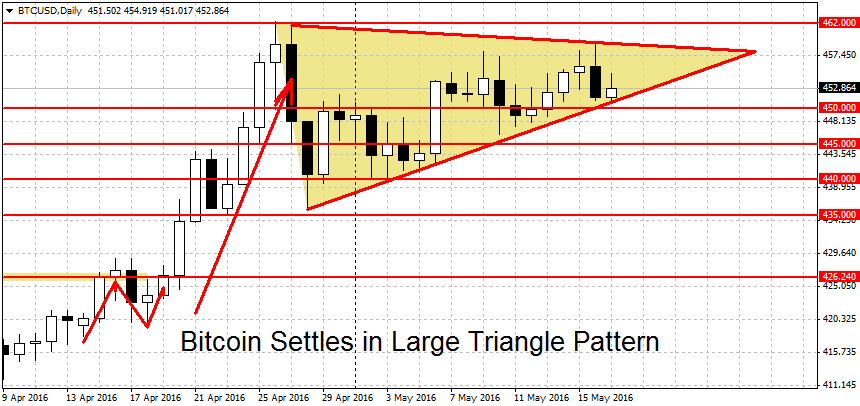
Theory says that ascending triangles point to more gains going forward. Still, a more prudent approach would be to wait for prices to breakout first. We’re currently quoted at $452 dollars per coin and the high is at $462 dollars. A decisive breakout above the $462-$465 resistance on Fxopen and $470-$475 on other bitcoin exchanges should jump-start the lost bullish momentum. A clean break of this resistance has the potential for quick gains toward the $500 round figure, last year’s high for BTC/USD on most exchanges. The medium-term trend is also bullish for bitcoin while the long-term trend is still neutral.
On the downside, a breakdown below the lower bound of the triangle around $445 may end the current uptrend. A break of the next swing low at $435 dollars may turn the short-term trend to bearish. The breakout point for the current rally near $426 dollars may act as support, at least temporarily. We have more levels on the downside at the $412 swing low and the round $400 figure.
Litecoin in its Own Triangle
Alternative cryptocurrency Litecoin is in a similar boat as big brother. Prices here are wedged in their own triangle. We peaked at $4.194 on April 17th and have been range-bound ever since. On the chart below we can see the price action in LTC/USD during the past few weeks.
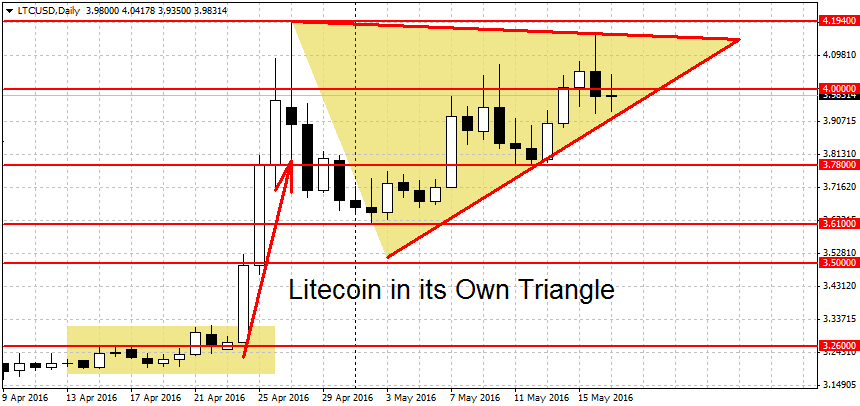
A clean breakout of the highs at $4.194 would confirm the ascending triangle as a trend continuation pattern. Above here we have resistance at the round $4.50 figure, followed by the $4.85 swing high. Higher up we have another round figure at $5 dollars. From here we have a large gap to the next level at $8.64 dollars (2015 high) but as we’ve written previously, some resistance levels are likely to emerge in between. Potential candidates include the round figures at $6, $7 and $8 dollars as well as $6.50 and $7.50. These round figures often act as support/resistance levels or price magnets.
On the downside, a decisive break of the lower bound of the triangle near $3.78 dollars per coin would end the current rally.
FXOpen offers the world's most popular cryptocurrency CFDs*, including Bitcoin and Ethereum. Floating spreads, 1:2 leverage — at your service. Open your trading account now or learn more about crypto CFD trading with FXOpen.
*At FXOpen UK and FXOpen AU, Cryptocurrency CFDs are only available for trading by those clients categorised as Professional clients under FCA Rules and Professional clients under ASIC Rules respectively. They are not available for trading by Retail clients.
This article represents the opinion of the Companies operating under the FXOpen brand only. It is not to be construed as an offer, solicitation, or recommendation with respect to products and services provided by the Companies operating under the FXOpen brand, nor is it to be considered financial advice.
Latest from Cryptocurrencies
Latest articles

Is There the Best Time to Trade Stock CFDs?
If you ask experienced traders, many will say that they trade on certain days or at certain times of the day. Their choice is determined by the market dynamics, volatility, and liquidity. It’s crucial to understand when the best

UnitedHealth (UNH) Share Price Surges after Strong Report
UnitedHealth shares surged Tuesday, rising more than 5% after the health care giant delivered stronger-than-expected first-quarter 2024 results:
→ earnings per share: actual = USD 6.91, expected = USD 6.61, last quarter = USD 6.16;
→ gross income: actual = USD 94.4

USD/JPY Analysis: Prospect of a Breakout of the Level of 155 Yen per Dollar
The USD/JPY rate has consistently reached new highs since 1990, approaching the psychological level of 155 yen per US dollar. The Japanese currency has already fallen about 9% against the dollar this year.
This is supported by Jerome Powell,