


FXOpen
The Bitcoin rally hit a stumbling block on Sunday as prices crashed close to $40 in one hour. Meanwhile, Litecoin was rejected at the $4 mark for the third time.
Bitcoin Rally Stalls
Bitcoin is up by less than 0.5% of $3 compared to last Tuesday. Initially, the momentum move higher took us to $628.25 on Sunday but shortly thereafter prices plunged to a low of $590 on most exchanges.
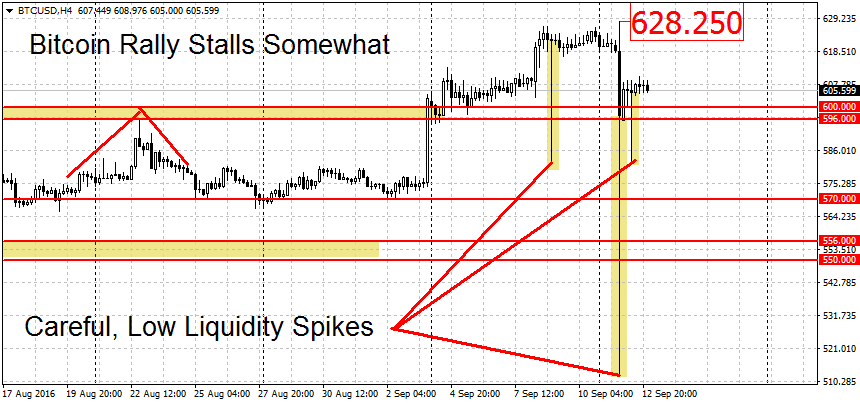
As we can see in the chart above, the crash was much bigger on FXOpen/BTC-E. Here the prices bottomed out at $512.21 on Sunday. Subsequently, we got two more spikes on Monday with lows at $586 and later $581 per coin. Zooming in on lower timeframes, we can see that it took less than a minute for the prices to bounce back. It appears that the crashes were due to thin orderbooks or technical malfunction.
In this environment caution should be exercised until the situation is rectified. This is especially the case if you have leveraged longs on the MetaTrader platform. Using limit orders instead of market orders should help to limit the slippage in some circumstances.
As the crash to $512 was platform specific and not broad-based, the rally is still in place. To end it, the bulls will have to decisively break the $570 figure. We’re looking for a clean break here, not just a brief shallow spike below. A break below $556 would switch the short-term trend from up to down.
To resume the upward momentum, we need to see prices retake the $628 high. A strong resistance level can be found at the $650 mark. This is followed by more resistance levels at $670, $687 and $700 per coin.
Litecoin Rejected at $4 Again
Alternative cryptocurrency Litecoin got rejected at the $4 mark for the third time. This time prices got as high as $4.01. The subsequent sell-off took LTC/USD to $3.77 per coin. We’re now quoted close to these lows at $3.80.
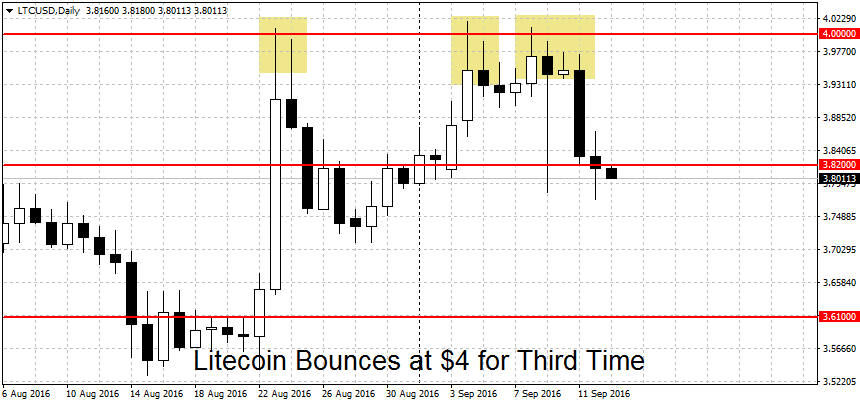
A decisive break above $4 is needed for a new short-term rally. Resistance levels above this round figure can be found at the $4.07 swing high, followed by $4.15. Higher up we find a resistance area from $4.43 to $4.52, a clearing of which could intensify the gains.
On the lower end, the bears need a break of the $3.70 level to restart the downtrend. Below here we have a support at the $3.53 swing low followed by the $3.50 round figure. Further down we have more support at the $3.22 lows hit in the aftermath of the Bitfinex hack. More levels down can be found at the $3 round figure, followed by this year’s low at $2.89 and the twelve-month low near $2.50 per coin.
FXOpen offers the world's most popular cryptocurrency CFDs*, including Bitcoin and Ethereum. Floating spreads, 1:2 leverage — at your service. Open your trading account now or learn more about crypto CFD trading with FXOpen.
*At FXOpen UK and FXOpen AU, Cryptocurrency CFDs are only available for trading by those clients categorised as Professional clients under FCA Rules and Professional clients under ASIC Rules respectively. They are not available for trading by Retail clients.
This article represents the opinion of the Companies operating under the FXOpen brand only. It is not to be construed as an offer, solicitation, or recommendation with respect to products and services provided by the Companies operating under the FXOpen brand, nor is it to be considered financial advice.
Latest from Cryptocurrencies
Latest articles

Weekly Market Wrap With Gary Thomson: UK100, USD, GOLD, OIL
Get the latest scoop on the week's hottest headlines, all in one convenient video. Join Gary Thomson, the COO of FXOpen UK, as he breaks down the most significant news reports and shares his expert insights.
- UK100 Share Index Rises

What Is a Darvas Box Theory and How Does It Work in Trading?
The Darvas Box Theory, pioneered by Nicolas Darvas in the 1950s, has transcended its stock market origins to become a valuable tool for forex traders. This method leverages specific price movements and patterns, known as the Darvas Box, to track

NFLX Stock Price Falls Despite Subscriber Growth
Yesterday, after the close of the main trading session on the stock market, Netflix reported to investors for the 1st quarter of 2024.
The report turned out better than expected:
→ earnings per share: actual = USD 5.28, forecast = USD 4.