


FXOpen
After the massive $1,200 candle five days ago, bitcoin is struggling to continue the gains. Litecoin is trading mostly range-bound as well.
No Follow-through for Bitcoin
Bitcoin prices are having a hard time making headway during the past five days. We saw a new high of $8,425 on Sunday but this was quickly sold into by the bears. We are currently quoted at $8,097 dollars, only $10 above the highs made during the huge 40 minute candle, read more HERE.
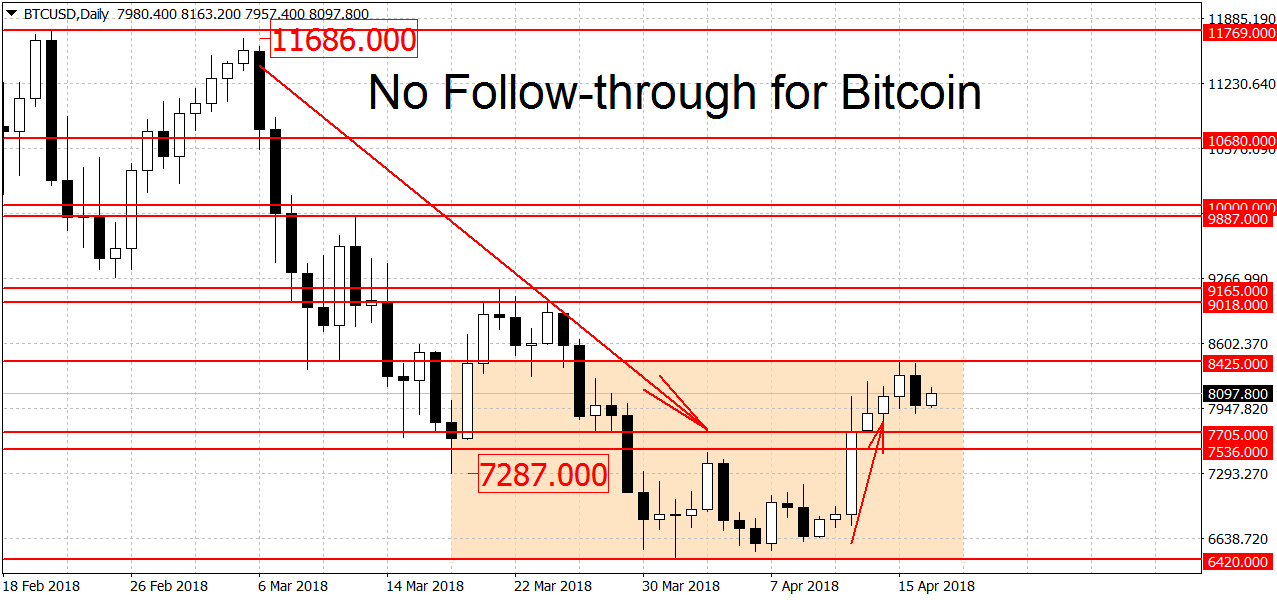
Technically little has changed since that article. Bitcoin is still in a range on the daily charts. To end it we need a breakout above $8,425 dollars to the upside. As usual we’re looking for a decisive breakout here not just a brief and shallow spike higher. Higher up there’s more resistance around the $9,000 round figure and the $9,165 swing high. Further up we have the $10,000 round figure, an important psychological barrier. This is followed by more resistance at $10,680, $11,000 and $11,769 dollars.
On the lower end the bears need a break of the support around the $6,420 swing low. A clearing of this strong support area would open the way for a break of this year’s low at $5,980 dollars per coin. On the longer-term weekly charts BTC/USD is range-bound as well. The monthly charts are still looking bullish.
Litecoin Ends Downtrend
Litecoin broke the important resistance at $135.52 today and hit a high of $140.12. Thus the altcoin managed to end the downtrend on the daily charts. We are quoted at $136.73 dollars right now, up by $8 or 6.25 percent.
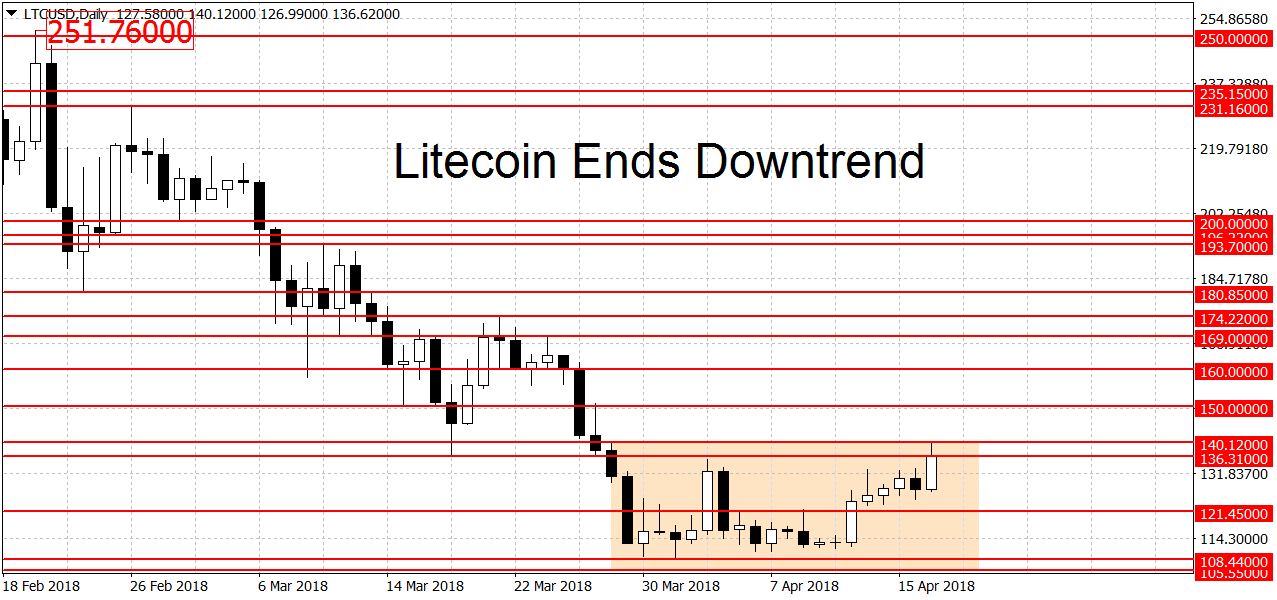
A new uptrend requires a breakout above $140.12 dollars. Resistance higher up can be found at the $150 and $160 round figures, followed by the swing highs at $169 and $174.22 dollars. A breakout above here could open the door to the $200 round figure.
On the lower end there’s strong support around the $108.44 swing low. But due to the proximity some may choose to wait for a break of the $105.55 swing low as well. This is the year’s low for LTC/USD. The $100 round figure may also act as support to falling prices but it probably won’t be as hard to crack as the two above mentioned levels. On the longer-term weekly and monthly charts Litecoin is still keeping the bullish bias.
FXOpen offers the world's most popular cryptocurrency CFDs*, including Bitcoin and Ethereum. Floating spreads, 1:2 leverage — at your service. Open your trading account now or learn more about crypto CFD trading with FXOpen.
*At FXOpen UK and FXOpen AU, Cryptocurrency CFDs are only available for trading by those clients categorised as Professional clients under FCA Rules and Professional clients under ASIC Rules respectively. They are not available for trading by Retail clients.
This article represents the opinion of the Companies operating under the FXOpen brand only. It is not to be construed as an offer, solicitation, or recommendation with respect to products and services provided by the Companies operating under the FXOpen brand, nor is it to be considered financial advice.
Latest from Cryptocurrencies
Latest articles

What Order Imbalance Is and How To Use It in a Trading Strategy
Understanding the nuances of order imbalances is key for traders looking to navigate the ebb and flow of asset prices. Order imbalances provide a clear window into the supply and demand dynamics at play, offering strategic insights. This article delves

XAU/USD Gold Price Reaches an Important Resistance Zone
The XAU/USD gold chart today indicates that the historical record price of the metal is above USD 2,400 per ounce.
In addition to fears of a new round of inflation due to rising commodity prices, geopolitical tensions are

What Is a Break of Structure and How Can You Trade It?
In the ever-evolving world of Smart Money Concept (SMC) trading, a nuanced understanding of market dynamics is indispensable. This article explores the concept of Break of Structure (BOS), how to identify it, and its implications for trading strategies, setting traders