


FXOpen

BTC/USD
Since the start of the week, we have seen the price of Bitcoin increasing to $10950 area which was its highest point yesterday. But since then the price made a decrease of 2.74% and fell to $10685 at its lowest point. Currently, we are seeing the price in an upward trajectory and being traded at $10793 with it looking like the increase is likely to continue.
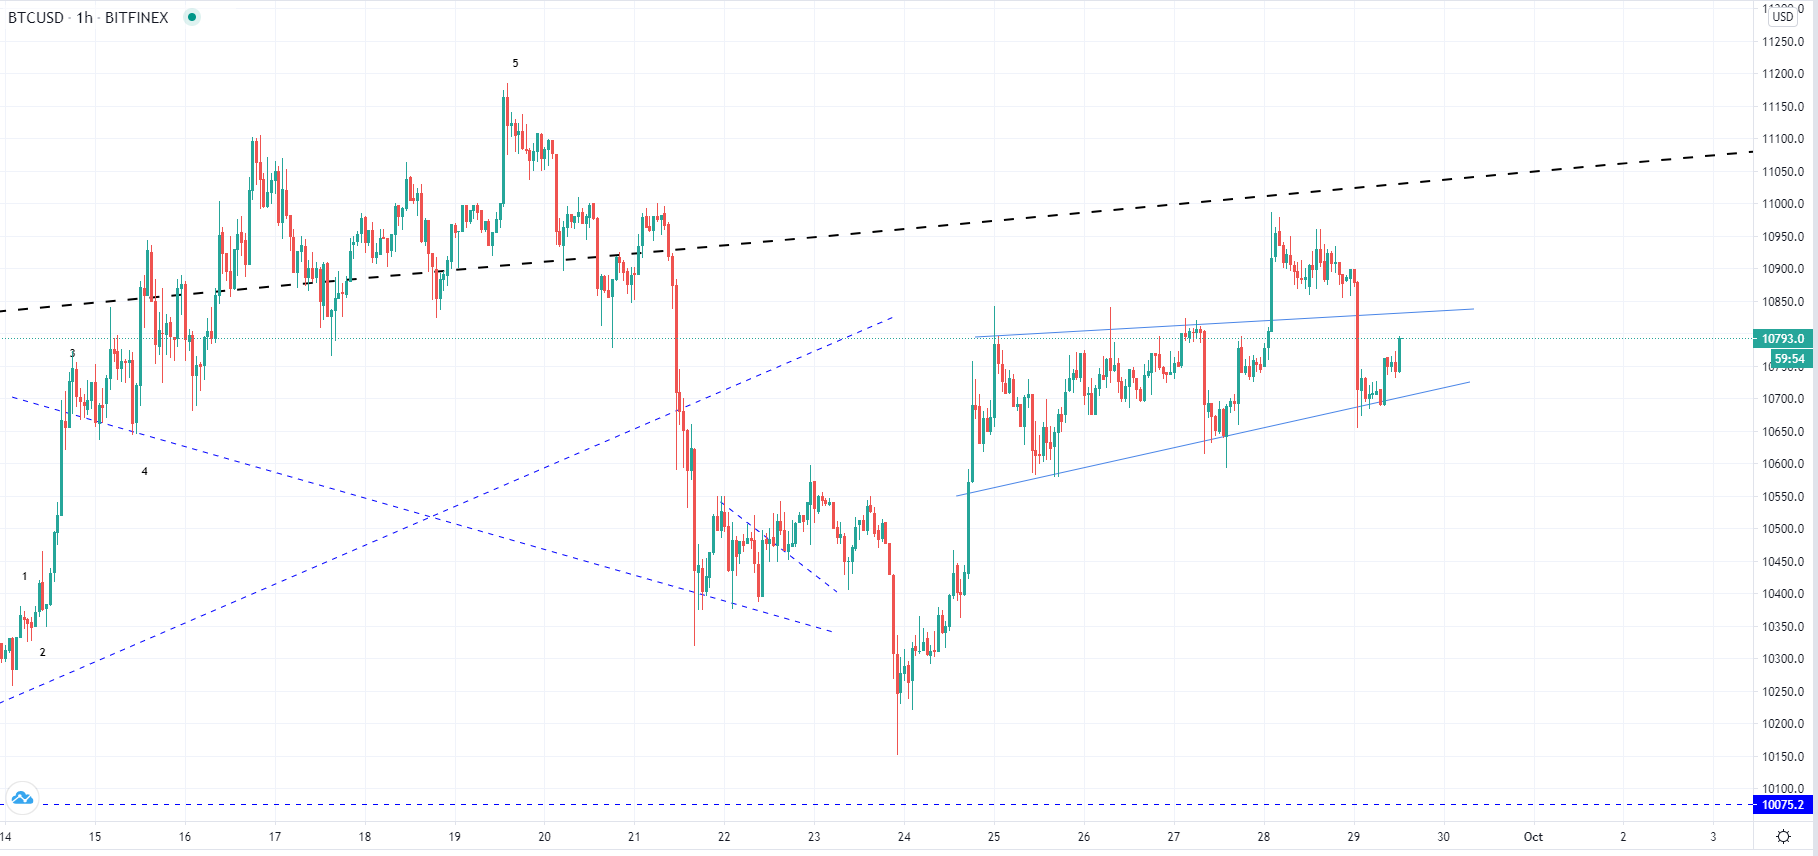
On the hourly chart, you can see that from last week’s Thursday when the price came down to $10240 level and even spiked further down, we have seen bullish price action with the price coming up by around 7% measured to the yesterday’s high. As it came up to retest the previous lower degree horizontal level that served as support but was broken on the 21st of September it made an ascending triangle. Yesterday’s high could be considered as a fakeout with the price attempting to break its resistance level but a slight move above it pushed the price impulsively to its support level immediately after.
Now as the support level has been retested and it proved to serve as the support we are seeing another bounce but it is still unclear whether or not this bounce is set to push the price for a proper breakout to the upside or is it a minor corrective increase before the further decline. This will shortly be validated by the interaction the ascending triangle’s resistance.
XRP/USD
The price of Ripple has decreased as well since yesterday and came down by around 2.55% but manage to make up those losses and is currently being traded around the levels of the yesterday’s downfall starting point. These are the levels of the horizontal support now serving as resistance and was validated again on yesterday’s interaction.
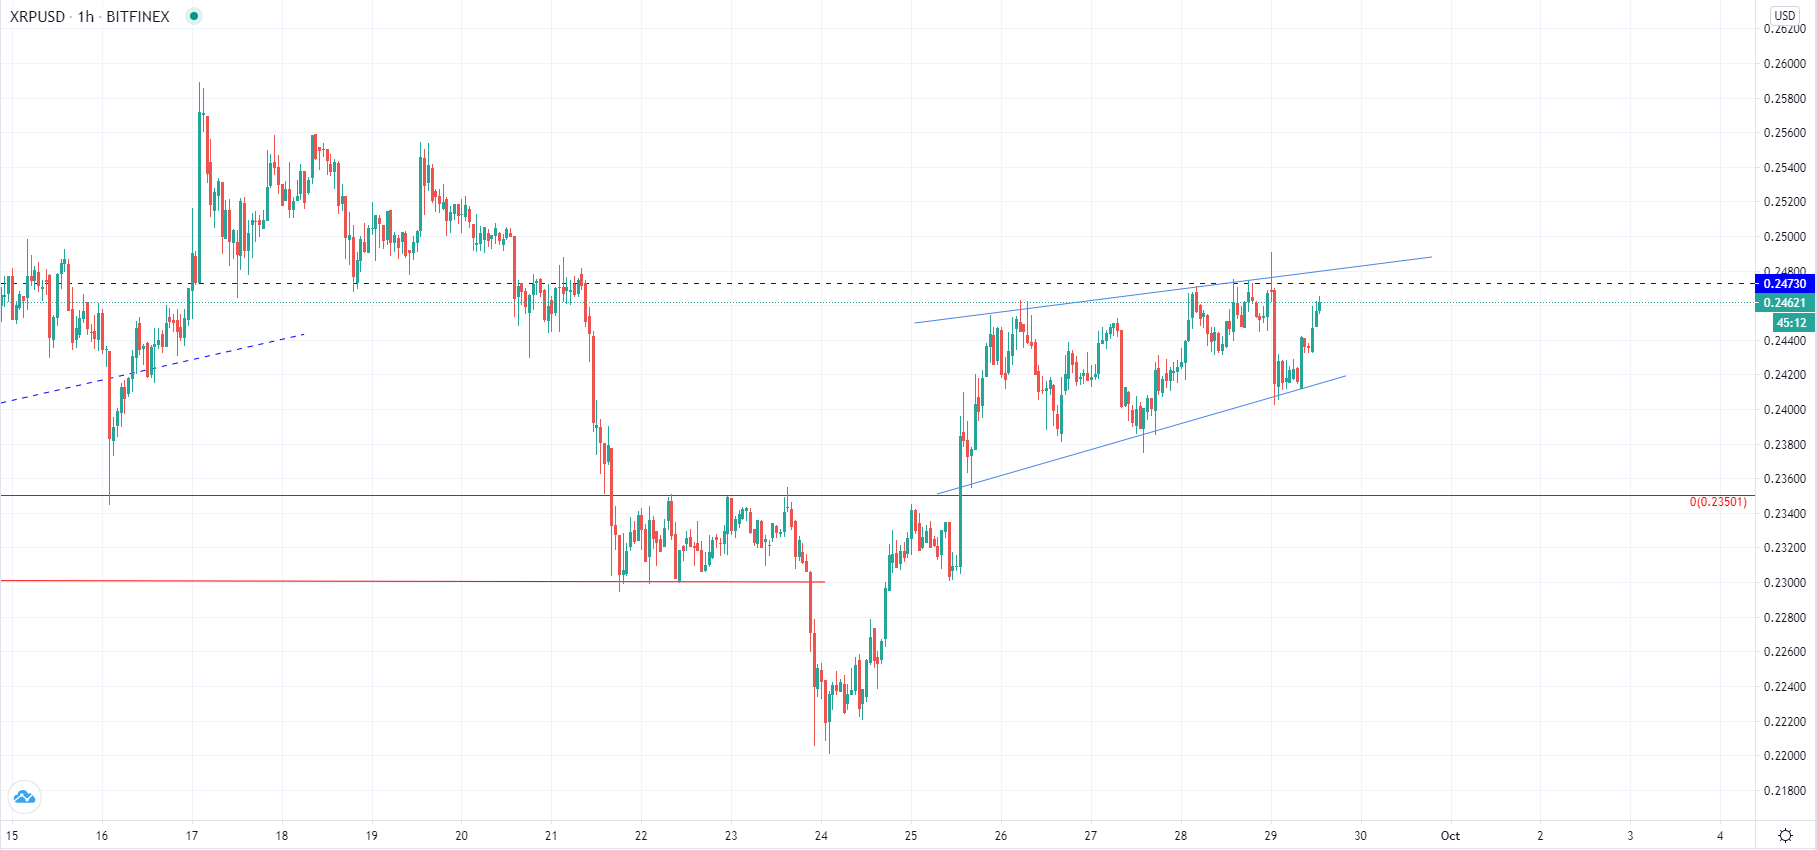
Looking at the hourly chart, you can see that unlike in the case of Bitcoin the price of Ripple hasn’t made a fakeout and instead made a continuation of the ascending triangle formation with the price coming to its support level again today where it found support. As the price is now in an upward trajectory we are shortly going to see if it manages to break the upper horizontal level or not, but from the steepness of the horizontal level, it looks more likely that the increase is to continue.
If however the price gets rejected again at the horizontal level it could potentially set it up for another downturn below its last week’s low at $0.222. But more likely we are going to see a breakout to the upside as this ascending structure is showing bullish sings.
FXOpen offers the world's most popular cryptocurrency CFDs*, including Bitcoin and Ethereum. Floating spreads, 1:2 leverage — at your service. Open your trading account now or learn more about crypto CFD trading with FXOpen.
*At FXOpen UK and FXOpen AU, Cryptocurrency CFDs are only available for trading by those clients categorised as Professional clients under FCA Rules and Professional clients under ASIC Rules respectively. They are not available for trading by Retail clients.
This article represents the opinion of the Companies operating under the FXOpen brand only. It is not to be construed as an offer, solicitation, or recommendation with respect to products and services provided by the Companies operating under the FXOpen brand, nor is it to be considered financial advice.
Latest from Cryptocurrencies
Latest articles

Weekly Market Wrap With Gary Thomson: UK100, USD, GOLD, OIL
Get the latest scoop on the week's hottest headlines, all in one convenient video. Join Gary Thomson, the COO of FXOpen UK, as he breaks down the most significant news reports and shares his expert insights.
- UK100 Share Index Rises

What Is a Darvas Box Theory and How Does It Work in Trading?
The Darvas Box Theory, pioneered by Nicolas Darvas in the 1950s, has transcended its stock market origins to become a valuable tool for forex traders. This method leverages specific price movements and patterns, known as the Darvas Box, to track

NFLX Stock Price Falls Despite Subscriber Growth
Yesterday, after the close of the main trading session on the stock market, Netflix reported to investors for the 1st quarter of 2024.
The report turned out better than expected:
→ earnings per share: actual = USD 5.28, forecast = USD 4.