


FXOpen

BTC/USD
From yesterday’s open the price of Bitcoin has increased by 12.44% coming from its lowest point of $31,030 to $34,891 at its highest but has since then made a downfall. The price fell back to the same levels as on yesterday’s low and is now starting to make another recovery attempt. Currently it is sitting at around $32,221.

Looking at the hourly chart, you can see that the price made a recovery from the 22nd of January when it fell to $28,785 at its lowest wick. The decrease to those levels was the completion of the 3rd wave from the corrective structure that started developing after the all-time high.
We could have seen the completion of the correction, but the wave structure is still looking more corrective than impulsive on the recovery that followed. This is why more likely, we are seeing the corrective wave continuation in the form of the second wave X from the WXYXZ complex count.
As you can see the price made a descending triangle from its all-time high and since it made interaction with its resistance level, now we are going to have a validation of the assumed scenario as if the price is in a prolonged correction now the Z wave is shortly going to start developing. That means that now a breakout to the downside would be shortly expected.
If this starts developing the price of Bitcoin could fall back to the $24,000 area where the next significant horizontal support level in line with the downside. This would be a downfall of just over 30% which would be a highly significant one.
XRP/USD
The price of Ripple has been moving sideways from the 22nd of January when it spiked down to $0.24 area from where it made a recovery to $0.28 level. Since the price has been in this horizontal range we have seen further support and resistance testing with the price currently sitting at $0.26645.
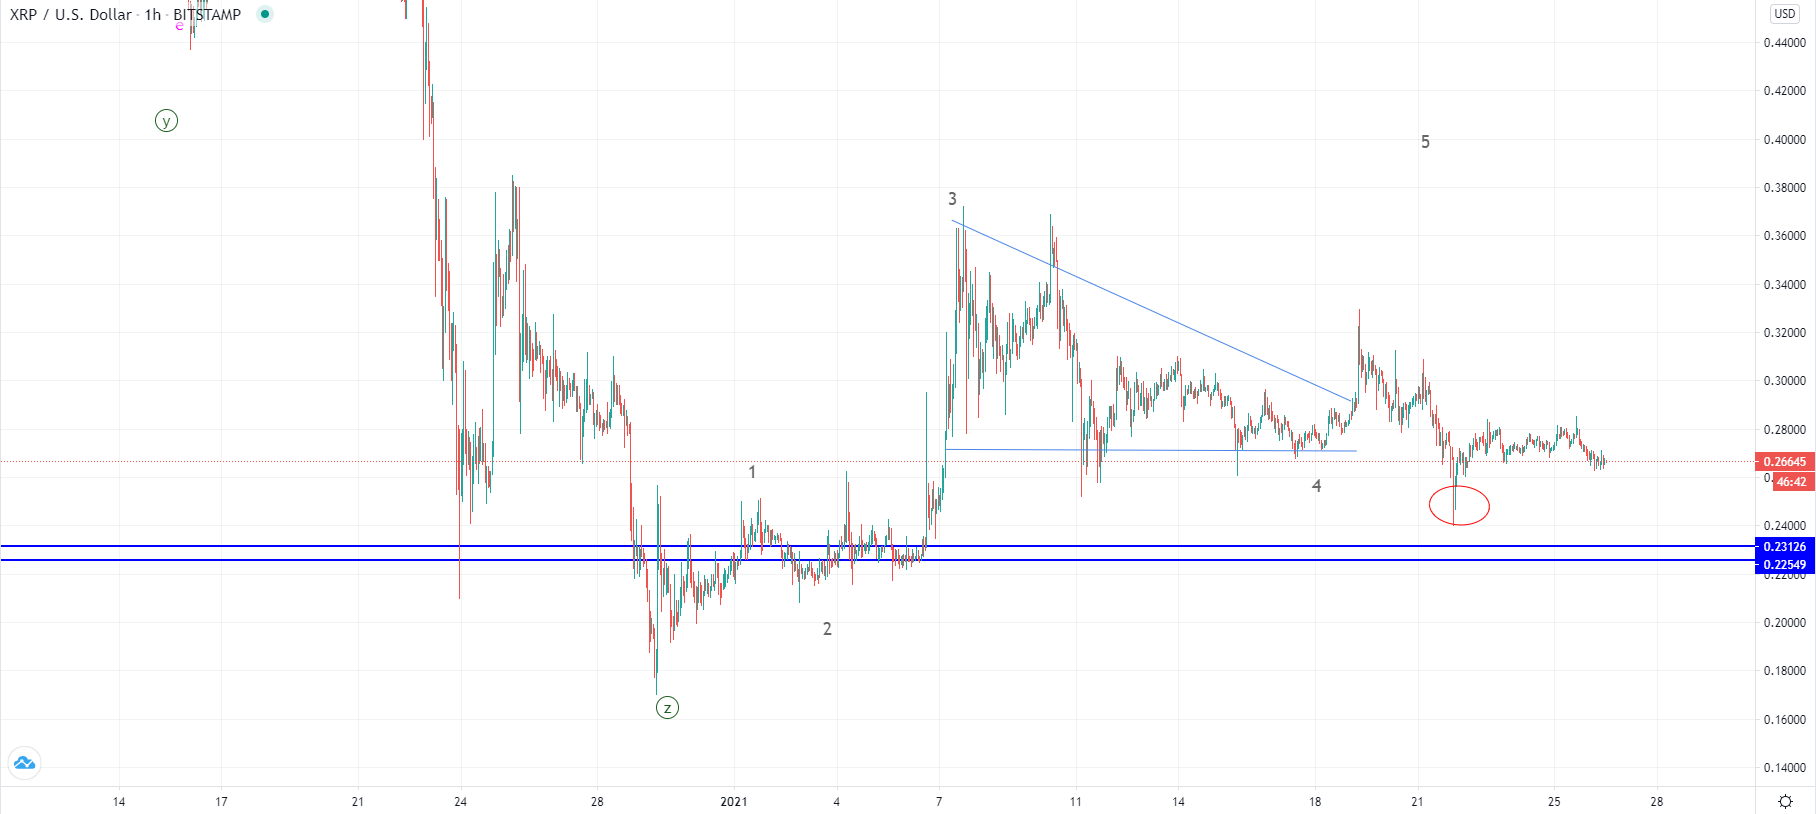
As you can see from the hourly chart, the price has previously made a breakout to the upside from the descending triangle in which it was since the 8th of January but failed to continue moving to the upside. The assumed scenario was the five-wave impulse to the upside but since the price spiked inside the territory of the 1st wave this is starting to get invalidated. Instead, more likely we have seen a three-wave upside corrective move before further downside continuation.
However, the quick spike on the 22nd could have been the completion of the 4th wave although unlikely at this point. In the upcoming period, we are going to see if the invalidation gets confirmed and that is going to be indicated from the breakout direction of the current horizontal range.
FXOpen offers the world's most popular cryptocurrency CFDs*, including Bitcoin and Ethereum. Floating spreads, 1:2 leverage — at your service. Open your trading account now or learn more about crypto CFD trading with FXOpen.
*At FXOpen UK and FXOpen AU, Cryptocurrency CFDs are only available for trading by those clients categorised as Professional clients under FCA Rules and Professional clients under ASIC Rules respectively. They are not available for trading by Retail clients.
This article represents the opinion of the Companies operating under the FXOpen brand only. It is not to be construed as an offer, solicitation, or recommendation with respect to products and services provided by the Companies operating under the FXOpen brand, nor is it to be considered financial advice.
Latest from Cryptocurrencies
Latest articles

What Order Imbalance Is and How To Use It in a Trading Strategy
Understanding the nuances of order imbalances is key for traders looking to navigate the ebb and flow of asset prices. Order imbalances provide a clear window into the supply and demand dynamics at play, offering strategic insights. This article delves

XAU/USD Gold Price Reaches an Important Resistance Zone
The XAU/USD gold chart today indicates that the historical record price of the metal is above USD 2,400 per ounce.
In addition to fears of a new round of inflation due to rising commodity prices, geopolitical tensions are

What Is a Break of Structure and How Can You Trade It?
In the ever-evolving world of Smart Money Concept (SMC) trading, a nuanced understanding of market dynamics is indispensable. This article explores the concept of Break of Structure (BOS), how to identify it, and its implications for trading strategies, setting traders