


FXOpen
BTC/USD
From Sunday’s low at around $43,070, the price of Bitcoin came up $49,579 at its highest point today which was a recovery of 15%. Since today’s high, we have seen a minor pullback but the price is still in an upward trajectory overall.
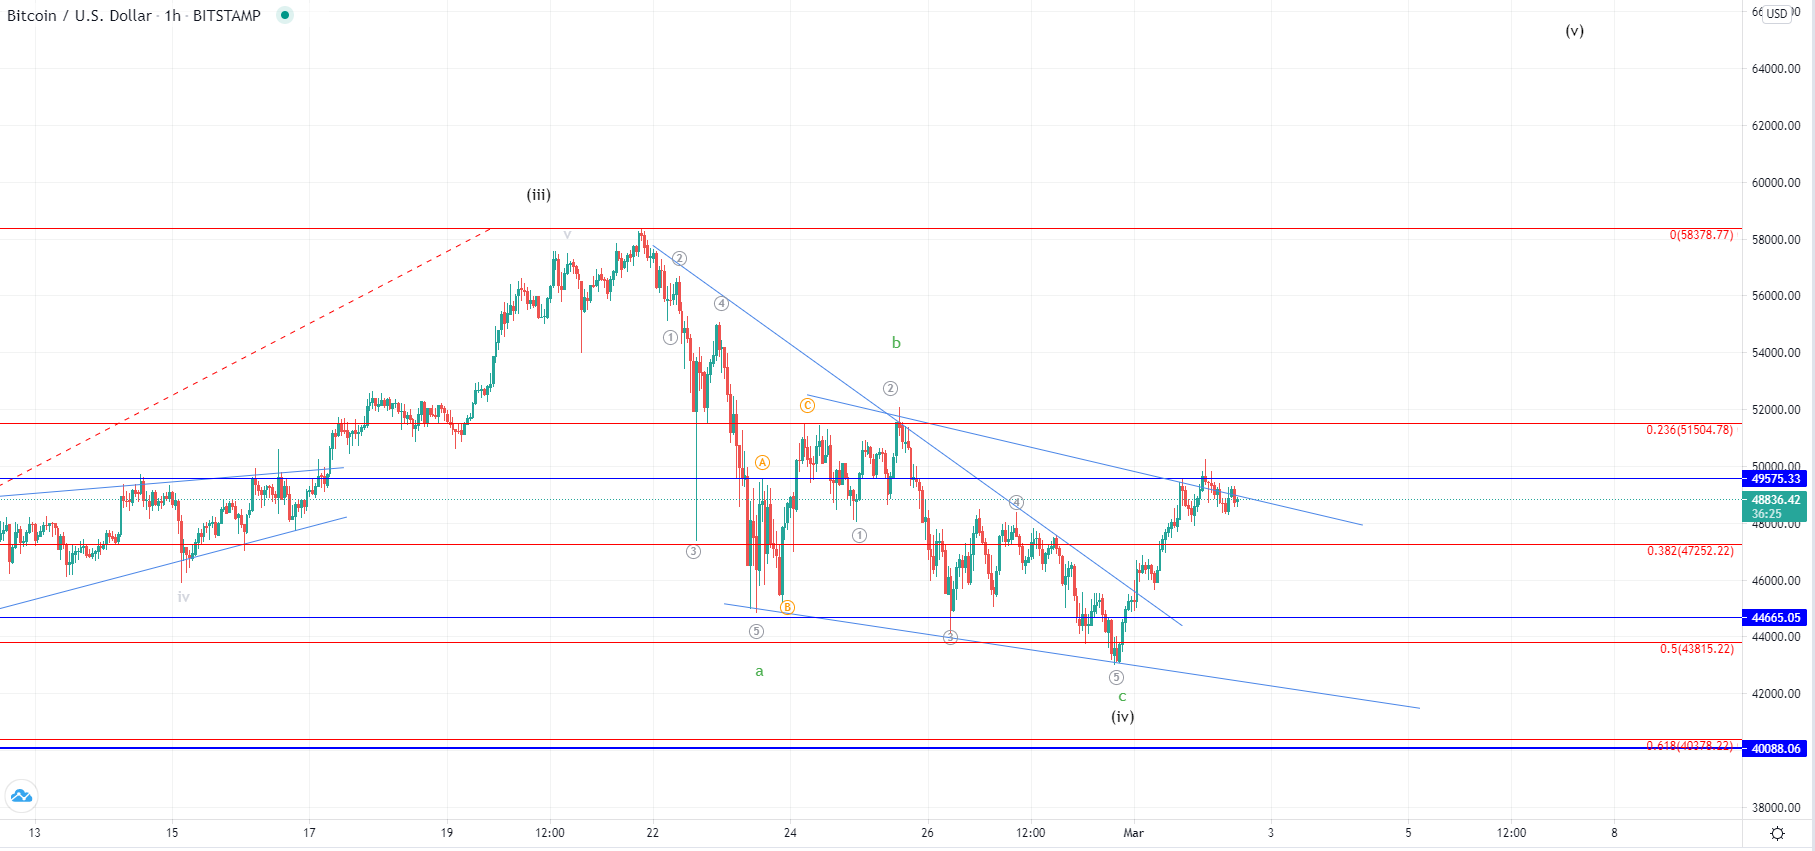
This recovery of 15% was a breakout from the descending triangle that formed from the 25th of February and was the 3rd sub-wave from the correctional move that started on the 21st. The price found support on the 0.5 Fib level on Sunday which led to the price increase and ultimately to a breakout but now new resistance has been encountered above the prior local high at the significant horizontal level.
We could have seen the completion of the 4th corrective wave from the higher degree count with the wave structure implying that the descending triangle from which it broke was the C wave from the lower degree count. If this is true, then the current rise is the next starting impulse that is going to push the price of Bitcoin above its prior all-time high onto the next one. But first, there must be a validation which would come in a form of a breakout from the currently interacted horizontal resitance level. This is why now the pullback might continue to the 0.382 Fib level where if the price finds support, further uptrend continuation would be expected.
XRP/USD
The price of Ripple has also been increasing from Sunday and came up from $0.396 to $0.45325 at its highest point today, which was an increase of 14.44%. Currently, it is being traded at $0.44327 and is moving sideways.
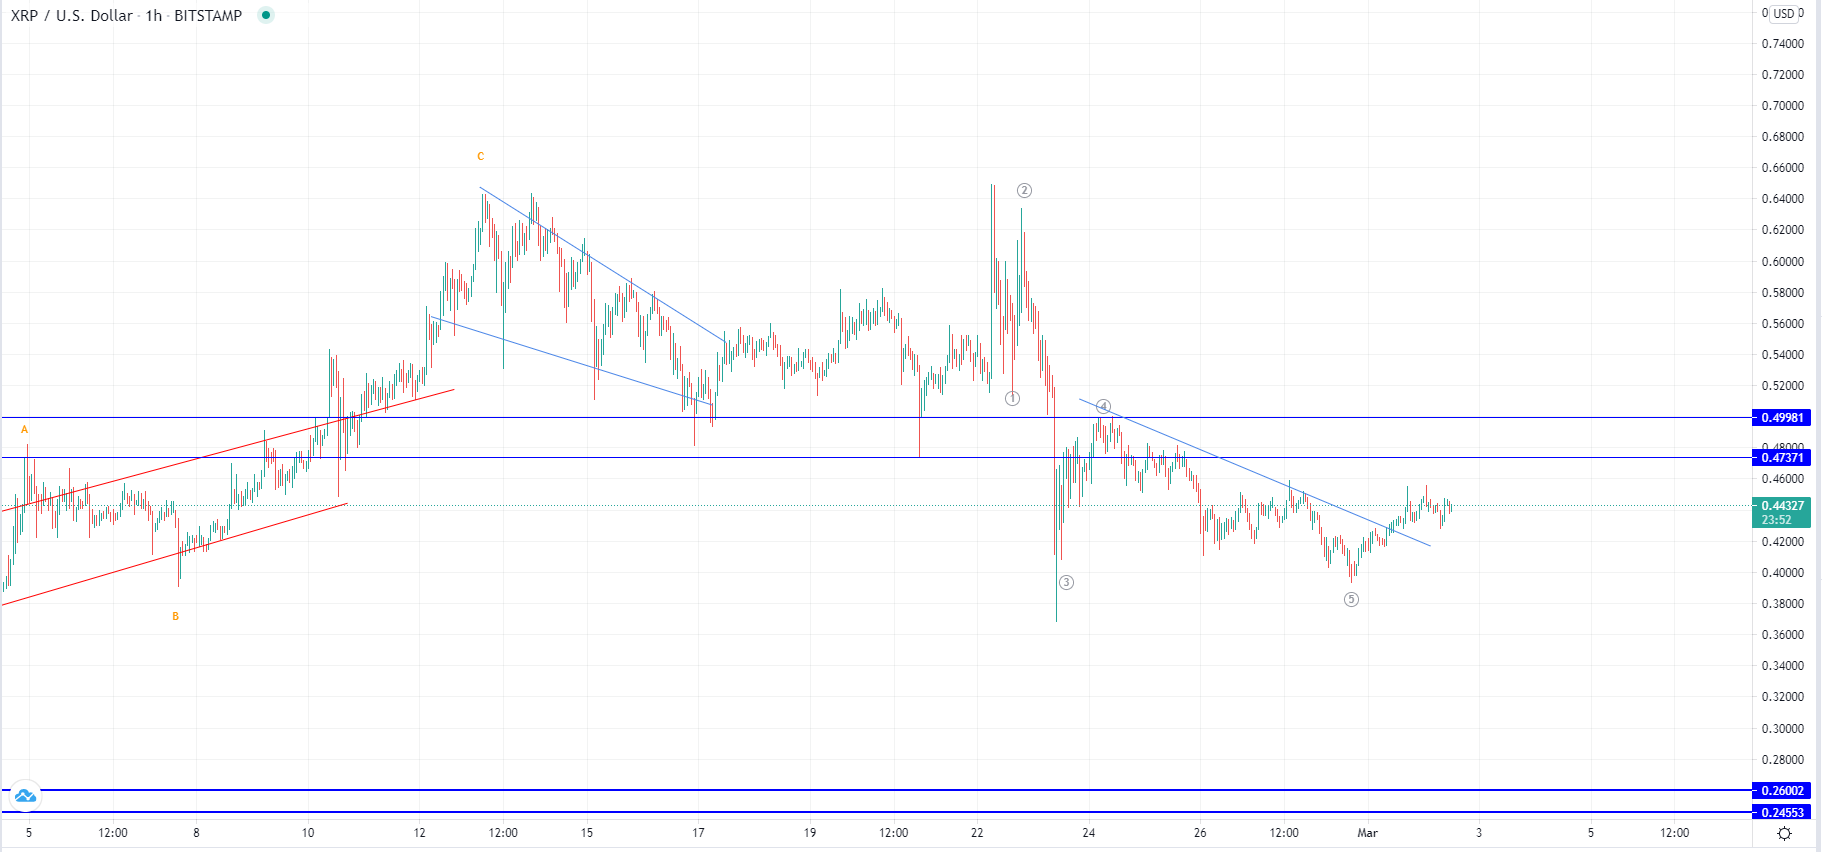
Looking at the hourly chart, you can see that the price of Ripple made a breakout from its descendent triangle as well but unlike in the case of Bitcoin hasn’t exceeded its prior local high, but instead found resistance at its levels. This is why now a cluster is being formed at the horizontal level as the price is retesting it for resistance. If the bullish momentum is still present another breakout is likely to occur which would lead the price of Ripple for interaction with the more significant zone between $0.48 and $0.5
Since the previous descending move appears to have ended, the continuation of the upward trajectory looks highly likely but from the interaction with the now found resistance, we are going to see if the bulls manage to maintain control which is going to dictate the next trend direction.
This forecast represents FXOpen Markets Limited opinion only, it should not be construed as an offer, invitation or recommendation in respect to FXOpen Markets Limited products and services or as financial advice.
Cryptocurrency CFDs are not available to trade in all jurisdictions.
FXOpen offers the world's most popular cryptocurrency CFDs*, including Bitcoin and Ethereum. Floating spreads, 1:2 leverage — at your service. Open your trading account now or learn more about crypto CFD trading with FXOpen.
*At FXOpen UK and FXOpen AU, Cryptocurrency CFDs are only available for trading by those clients categorised as Professional clients under FCA Rules and Professional clients under ASIC Rules respectively. They are not available for trading by Retail clients.
This article represents the opinion of the Companies operating under the FXOpen brand only. It is not to be construed as an offer, solicitation, or recommendation with respect to products and services provided by the Companies operating under the FXOpen brand, nor is it to be considered financial advice.
Latest articles

Anchored VWAP and How You Can Use It in Forex Trading
In the world of forex trading, understanding the nuanced tools at your disposal can significantly enhance decision-making processes. One such sophisticated tool is the Anchored Volume-Weighted Average Price (Anchored VWAP), which refines the standard VWAP by allowing traders to set

META Share Price Collapses after Publication of Quarterly Report
Just yesterday, META's stock price closed at USD 493.50, up approximately 40% since the start of 2024 and up nearly 300% since the start of 2023.
However, following the release of Meta's quarterly report, its shares plummeted to USD

USD/JPY Analysis: The Rate Exceeds The Level of 155 Yen Per US Dollar
Today, the price of USD/JPY once again renewed its 34-year high, exceeding the level of 155 yen per dollar, which put pressure on the current authorities.
According to Reuters, officials are trying to maintain calm in the market.
"We