


FXOpen
BTC/USD
The price of Bitcoin has been on a decline since yesterday and from its high at $36,742 made a decrease of 11.67% measured to its lowest point today at $32,455. Currently, it is sitting at $32,850 as a minor recovery was made but the picture still looks breaking with more downside expected.
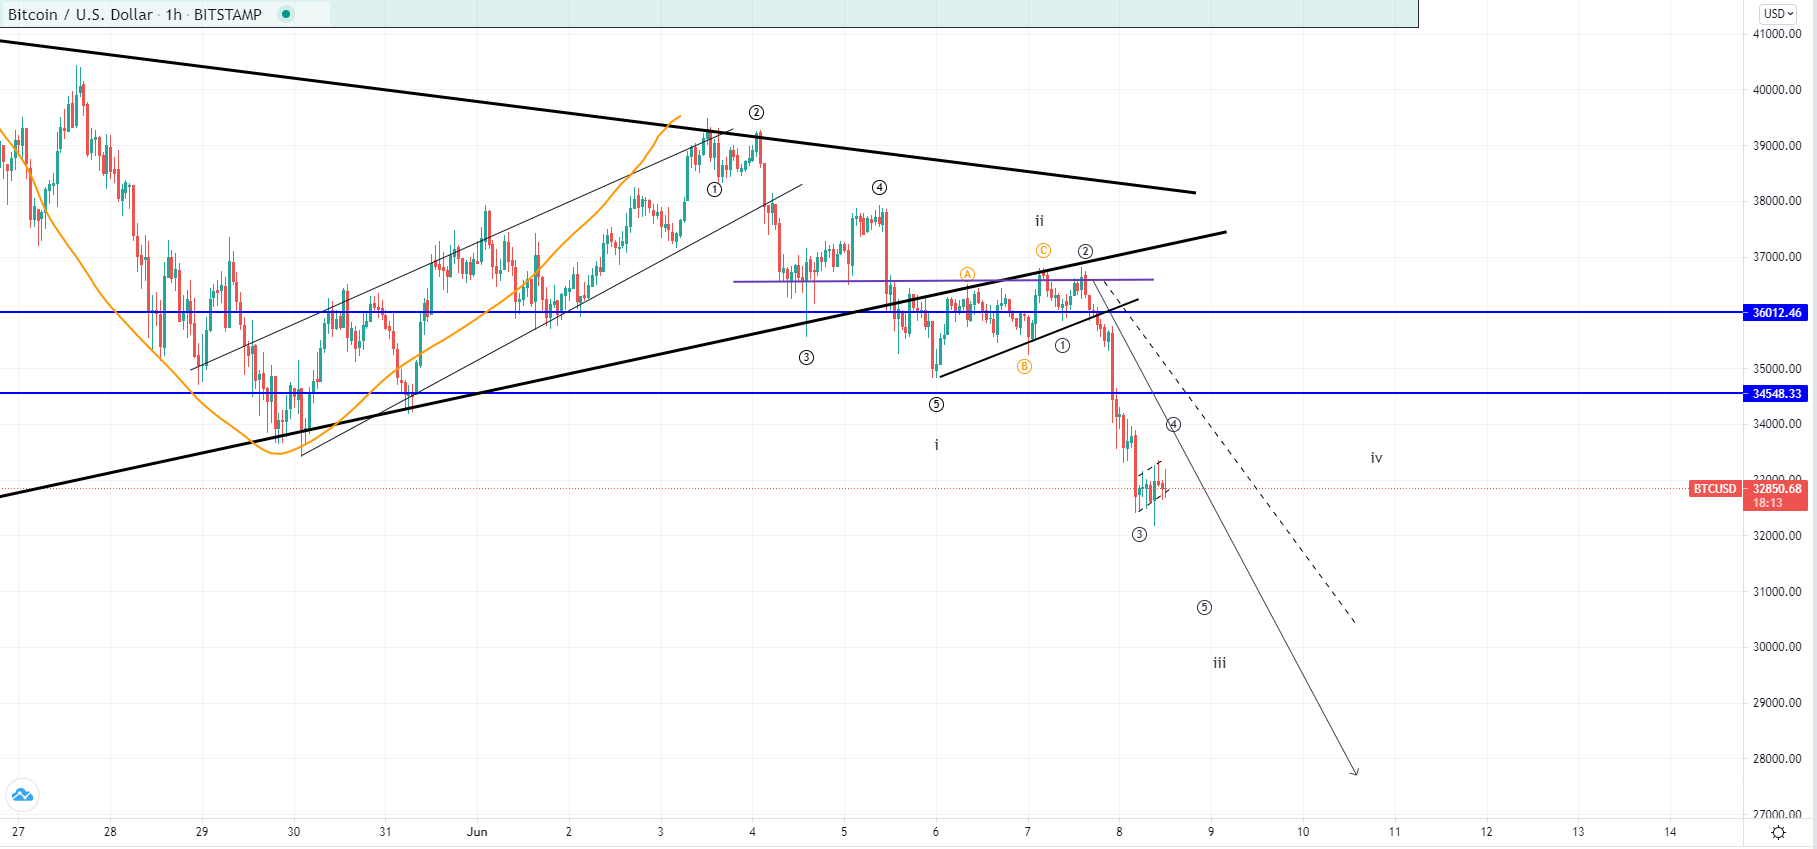 Looking at the hourly chart, you can see that the price has made a continuation of the descending move from the 3rd of June. A breakout was made from the ascending support on the 5th after which a test of prior support for resistance. As resistance was present the price continued moving further to the downside and breaking out from the horizontal levels. This is most likely the development of the 3rd wave out of the higher degree five-wave impulse that started on the 3rd of June.
If this is true then the price of Bitcoin is now headed to the vicinity of the $30,000 area where the next support level is. Recovery of the 4th wave could be seen but the projection takes back Bitcoin even further to the downside at around $27,500 area for the completion of the impulsive move.
XRP/USD
The price of Ripple has made a decrease of 14.5% from its yesterday’s high of $0.971 to $0.841 at its lowest point today. It made it back to the $0.882 at its highest point today at the minor recovery but is now again making a descending move.
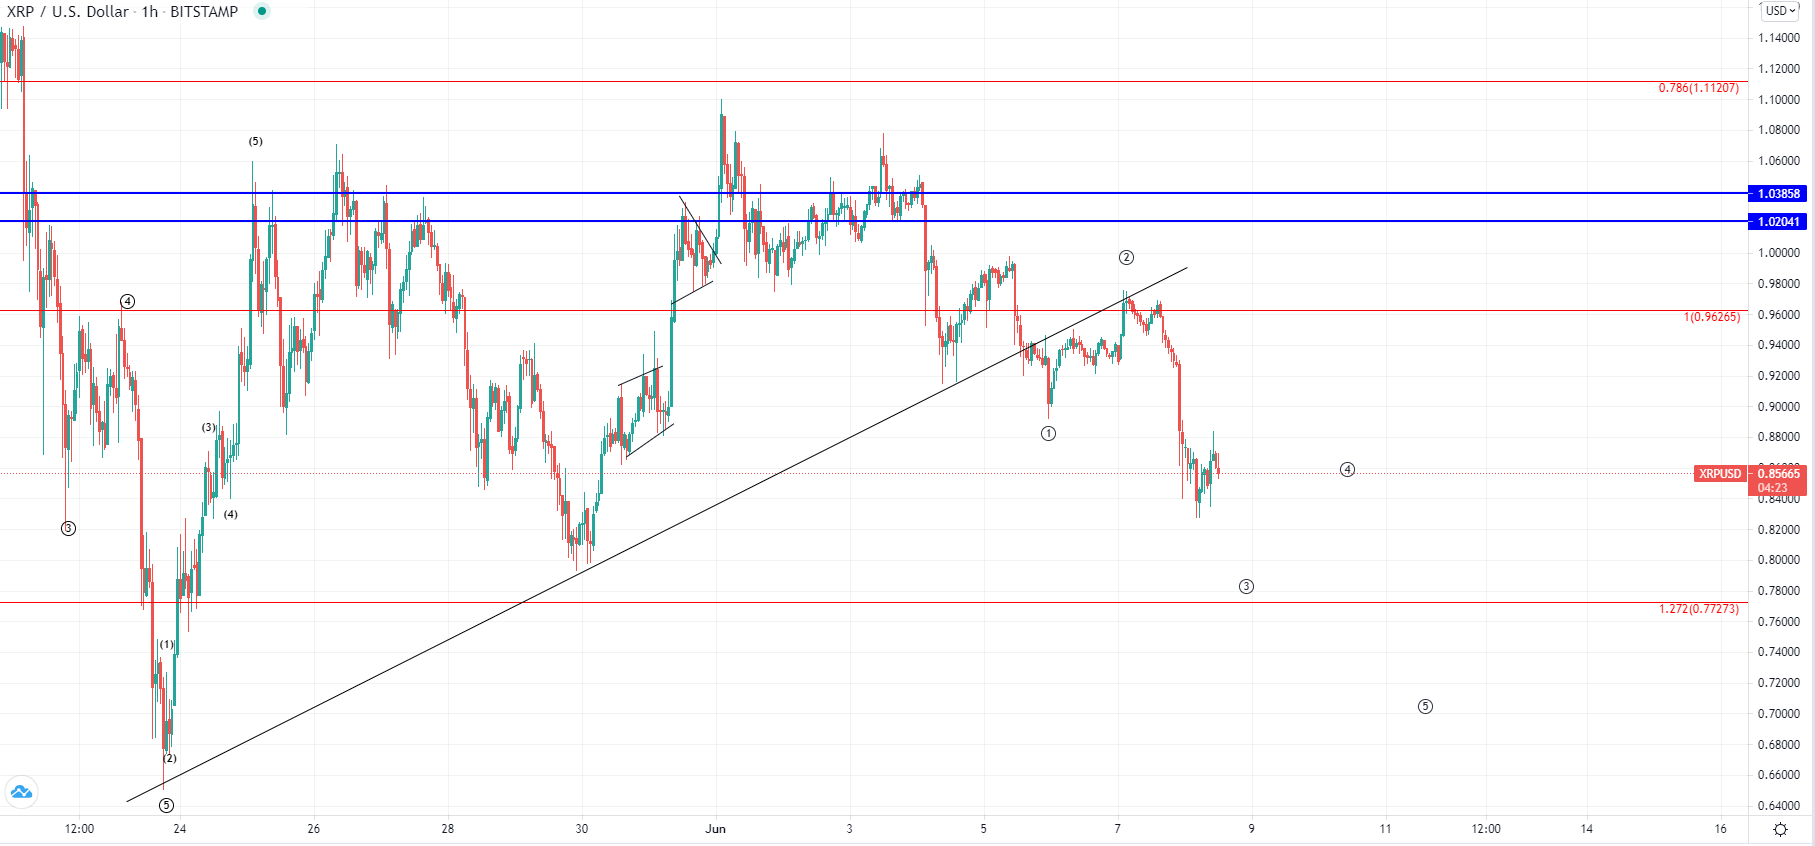
The same applies to the price of Ripple. We have seen most likely the developing 3rd wave from the impulse that started on the 3rd of June and made a breakout below the ascending support level. After yesterday’s retest for resistance, the price continued moving impulsively to the downside. Now the price would be expected to continue further after this current recovery which looks corrective in nature.
The price still hasn’t reached May 30th low at around $0.8 where the next support level could be. But after that and potentially a more significant recovery of the 4th wave another move to the downside would be expected potentially to the vicinity of the May 23rd low at around $0.66.
This forecast represents FXOpen Markets Limited opinion only, it should not be construed as an offer, invitation or recommendation in respect to FXOpen Markets Limited products and services or as financial advice. Cryptocurrency CFDs are not available to trade in all jurisdictions.
FXOpen offers the world's most popular cryptocurrency CFDs*, including Bitcoin and Ethereum. Floating spreads, 1:2 leverage — at your service. Open your trading account now or learn more about crypto CFD trading with FXOpen.
*At FXOpen UK and FXOpen AU, Cryptocurrency CFDs are only available for trading by those clients categorised as Professional clients under FCA Rules and Professional clients under ASIC Rules respectively. They are not available for trading by Retail clients.
This article represents the opinion of the Companies operating under the FXOpen brand only. It is not to be construed as an offer, solicitation, or recommendation with respect to products and services provided by the Companies operating under the FXOpen brand, nor is it to be considered financial advice.
Latest from Cryptocurrencies
Latest articles

Is There the Best Time to Trade Stock CFDs?
If you ask experienced traders, many will say that they trade on certain days or at certain times of the day. Their choice is determined by the market dynamics, volatility, and liquidity. It’s crucial to understand when the best

UnitedHealth (UNH) Share Price Surges after Strong Report
UnitedHealth shares surged Tuesday, rising more than 5% after the health care giant delivered stronger-than-expected first-quarter 2024 results:
→ earnings per share: actual = USD 6.91, expected = USD 6.61, last quarter = USD 6.16;
→ gross income: actual = USD 94.4

USD/JPY Analysis: Prospect of a Breakout of the Level of 155 Yen per Dollar
The USD/JPY rate has consistently reached new highs since 1990, approaching the psychological level of 155 yen per US dollar. The Japanese currency has already fallen about 9% against the dollar this year.
This is supported by Jerome Powell,