


FXOpen

BTC/USD
From yesterday’s low at $9292.9 the price of Bitcoin has increased by 5.48% coming to $9802 at its highest spike today but since then made a minor retracement and is currently being traded at $9614.
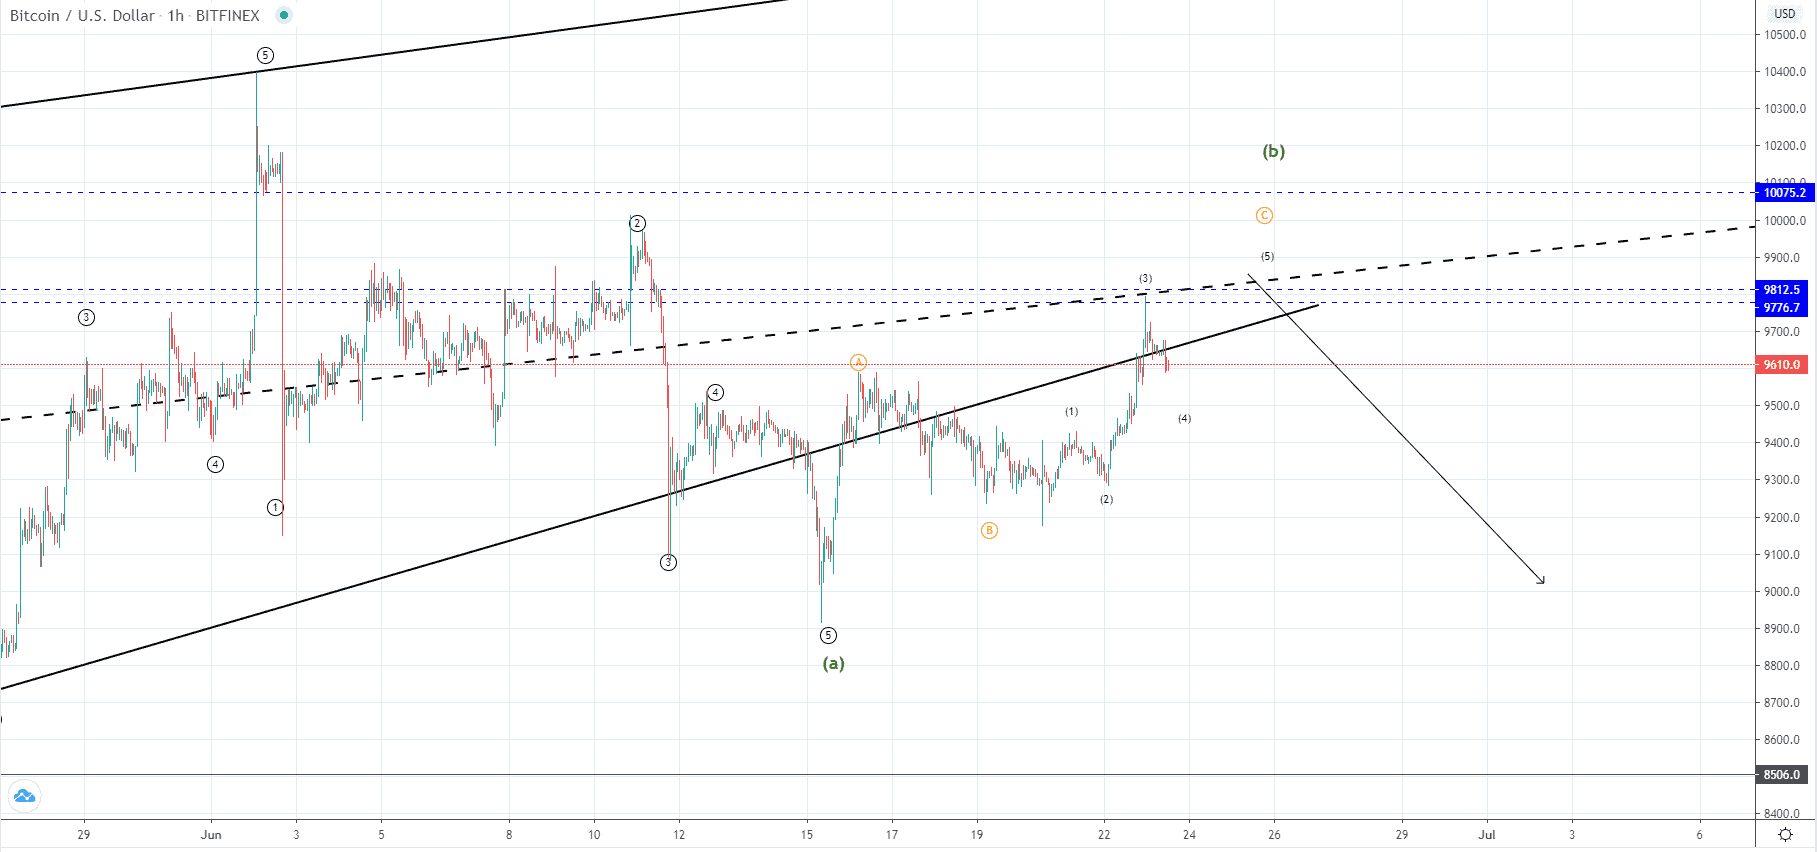
On the hourly chart, you can see that the price came up to retest the intersection of the significant horizontal resistance zone and the interrupted ascending trendline like previously expected before the completion of this ascending corrective move, but by looking at the wave structure it appears that the increase is likely to continue for another push to the upside which would be its 5th wave.
The price found resistance on the interaction and is now again trading below the support level of the ascending channel but further retest could be expected and potentially another enters in its territory as the upper horizontal level at $10075 could get retested before the completion of this ascending move. According to my count, this is a corrective ABC to the upside after an impulsive five-wave move to the downside so after its completion I would be expecting further downtrend continuation with a lower low ahead compared to the one made on 15th of June.
From the first half of Jun, we have most likely seen a B wave developing out of the higher degree ABC to the downside which is why it could, in theory, come all the way and even above the vicinity of the A wave’s starting point at around $10400 before continuing to move below $8910.
XRP/USD
The price of Ripple has been moving sideways unlike the price of Bitcoin as it came down from $0.1989 by 7% to $0.185 and is now around the half range of that currently at $0.189.
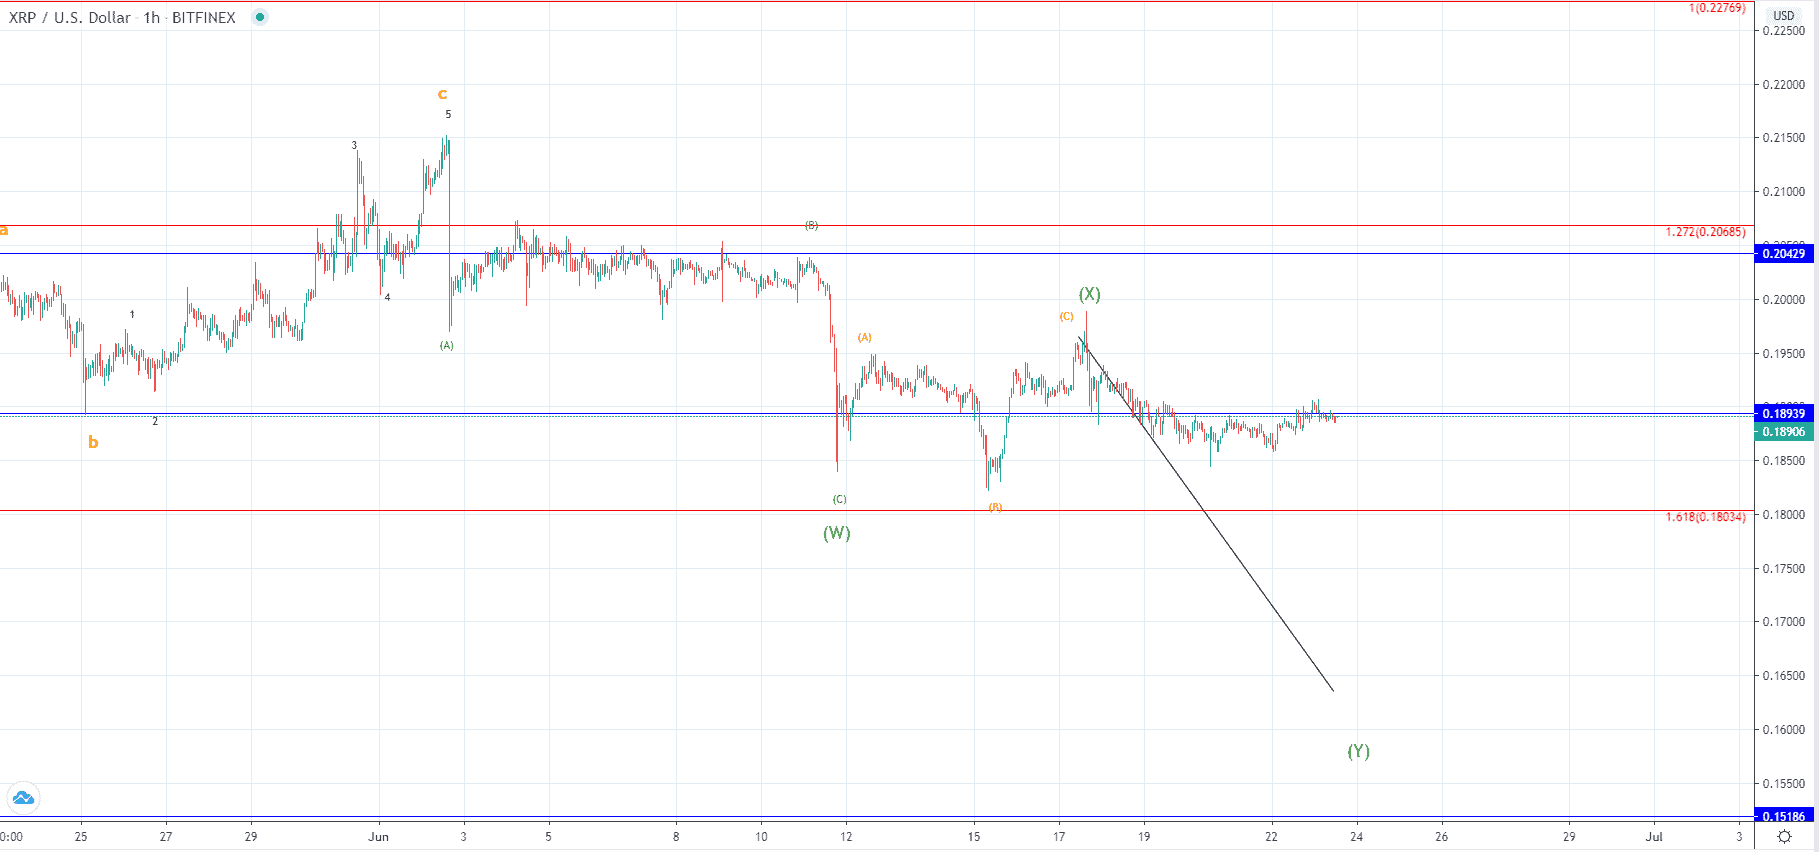
Looking at the hourly chart, you can see that’s it retesting the horizontal level broken on the way down that served as support now for resistance. If the resistance proves to be valid, we can see a hard rejection leading to the expected decrease but if the price gets above it, we could see further corrective increase development as the X wave hasn’t ended.
This is soon to be validated as interaction is being made, but if from the start of Jun, we have seen an ABC to the downside then from the 12th we have seen the second sub-wave of the higher degree which is currently labeled as the wave X. But if this X wave is the 4th wave out of the impulse one, we are to see a lower low most likely around the vicinity of the 1.618 Fibonacci level before the corrective increase starts.
FXOpen offers the world's most popular cryptocurrency CFDs*, including Bitcoin and Ethereum. Floating spreads, 1:2 leverage — at your service. Open your trading account now or learn more about crypto CFD trading with FXOpen.
*At FXOpen UK and FXOpen AU, Cryptocurrency CFDs are only available for trading by those clients categorised as Professional clients under FCA Rules and Professional clients under ASIC Rules respectively. They are not available for trading by Retail clients.
This article represents the opinion of the Companies operating under the FXOpen brand only. It is not to be construed as an offer, solicitation, or recommendation with respect to products and services provided by the Companies operating under the FXOpen brand, nor is it to be considered financial advice.
Latest from Cryptocurrencies
Latest articles

Is There the Best Time to Trade Stock CFDs?
If you ask experienced traders, many will say that they trade on certain days or at certain times of the day. Their choice is determined by the market dynamics, volatility, and liquidity. It’s crucial to understand when the best

UnitedHealth (UNH) Share Price Surges after Strong Report
UnitedHealth shares surged Tuesday, rising more than 5% after the health care giant delivered stronger-than-expected first-quarter 2024 results:
→ earnings per share: actual = USD 6.91, expected = USD 6.61, last quarter = USD 6.16;
→ gross income: actual = USD 94.4

USD/JPY Analysis: Prospect of a Breakout of the Level of 155 Yen per Dollar
The USD/JPY rate has consistently reached new highs since 1990, approaching the psychological level of 155 yen per US dollar. The Japanese currency has already fallen about 9% against the dollar this year.
This is supported by Jerome Powell,