


FXOpen

BTC/USD
From Monday’s high at $11843 the price of Bitcoin has decreased by 2.64% measured to today’s low at $11530. This is still a higher low compared to the low point made last Saturday, August 22nd from where we have seen the start of recovery which lead to the higher high made on Monday and is currently again in an upward trajectory sitting at $11653.
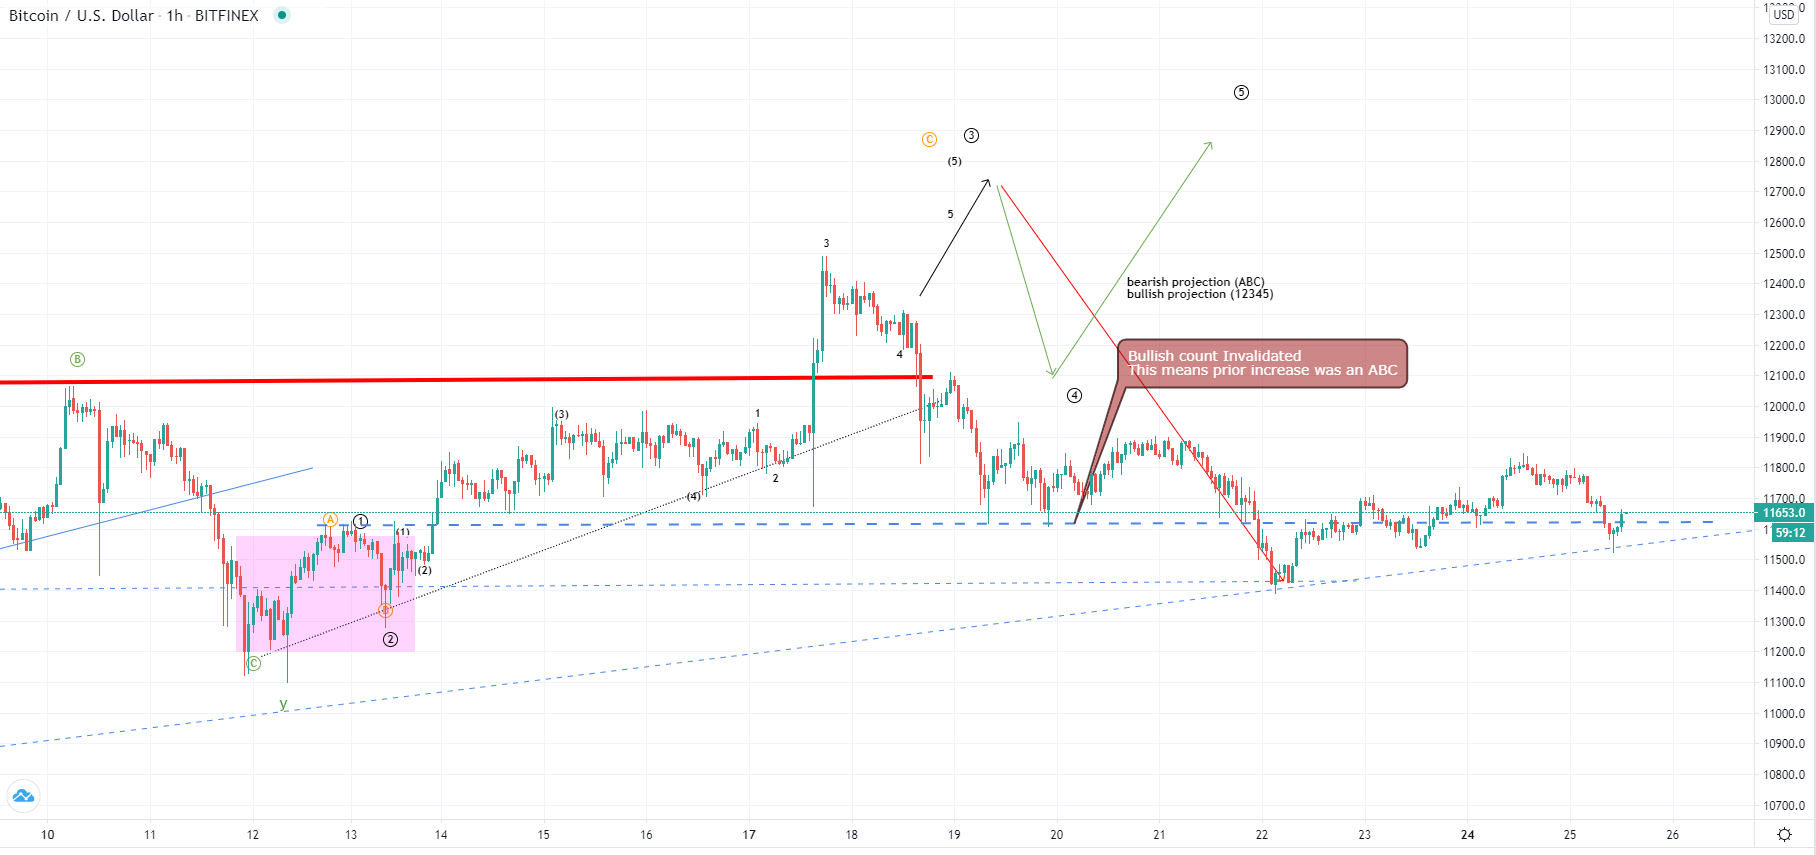
Looking at the hourly chart, we can see that the price is again back above the pivot point that was the ending point of the first sub-wave of the previous upward move, now validated as the wave A from the ABC correction count to the upside. As you can see the price hasn’t made the 5th wave out of the lower degree count before starting to move to my projected level in the bearish scenario I pointed out last week which is the ascending support from the range in which the price has been correcting since the 2nd of August.
Today the price came back to retest the ascending support level and made a bounce from it indicating that the support is still present, which is why we are likely to see this recovery continuing for another higher high at least. But if we have seen the end of the correction that started from the 2nd of August, the price count continues moving into the start of the higher degree 5th wave and breakout from the mentioned range, moving above $12400 level.
XRP/USD
The price of Ripple has decreased by 3.47% from yesterday’s high at $0.29243 as it fell to $0.28228 at its lowest point today. At the moment, the price is being traded slightly higher as it started moving to the upside after finding support on the still unconfirmed ascending channel.

On the hourly chart, you can see that another upside move would be expected from where with a higher high which would be the 5th wave out of the next higher degree move to the upside which could be the starting impulse. Prior to the recovery that started last Saturday, August 22nd, we have seen a decrease of 16.6% from the $0.3277 high made last Monday. The decrease was made in a three-wave manner slightly above my second target around the levels of the horizontal support from the 12th of August when the previous A wave to the upside is.
This could mean that the higher degree correction that started on the 2nd of August has ended and that we are seeing the first wave out of the next impulsive move to the upside. We are soon going to receive validation if the price continues increasing for another 5th wave and makes a higher high, validating the current ascending channel.
FXOpen offers the world's most popular cryptocurrency CFDs*, including Bitcoin and Ethereum. Floating spreads, 1:2 leverage — at your service. Open your trading account now or learn more about crypto CFD trading with FXOpen.
*At FXOpen UK and FXOpen AU, Cryptocurrency CFDs are only available for trading by those clients categorised as Professional clients under FCA Rules and Professional clients under ASIC Rules respectively. They are not available for trading by Retail clients.
This article represents the opinion of the Companies operating under the FXOpen brand only. It is not to be construed as an offer, solicitation, or recommendation with respect to products and services provided by the Companies operating under the FXOpen brand, nor is it to be considered financial advice.
Latest from Cryptocurrencies
Latest articles

What Order Imbalance Is and How To Use It in a Trading Strategy
Understanding the nuances of order imbalances is key for traders looking to navigate the ebb and flow of asset prices. Order imbalances provide a clear window into the supply and demand dynamics at play, offering strategic insights. This article delves

XAU/USD Gold Price Reaches an Important Resistance Zone
The XAU/USD gold chart today indicates that the historical record price of the metal is above USD 2,400 per ounce.
In addition to fears of a new round of inflation due to rising commodity prices, geopolitical tensions are

What Is a Break of Structure and How Can You Trade It?
In the ever-evolving world of Smart Money Concept (SMC) trading, a nuanced understanding of market dynamics is indispensable. This article explores the concept of Break of Structure (BOS), how to identify it, and its implications for trading strategies, setting traders