


FXOpen

BTC/USD
The price of Bitcoin has been in a decline since Sunday when it reached $34,716 at its highest point. We have seen a downfall to $30,367 but the price spiked further to $27,774 at its lowest wick before snapping back above the 0 Fib level. Currently, it is being consolidated above it and is moving sideways, sitting at $31,901 and is in an upward trajectory.
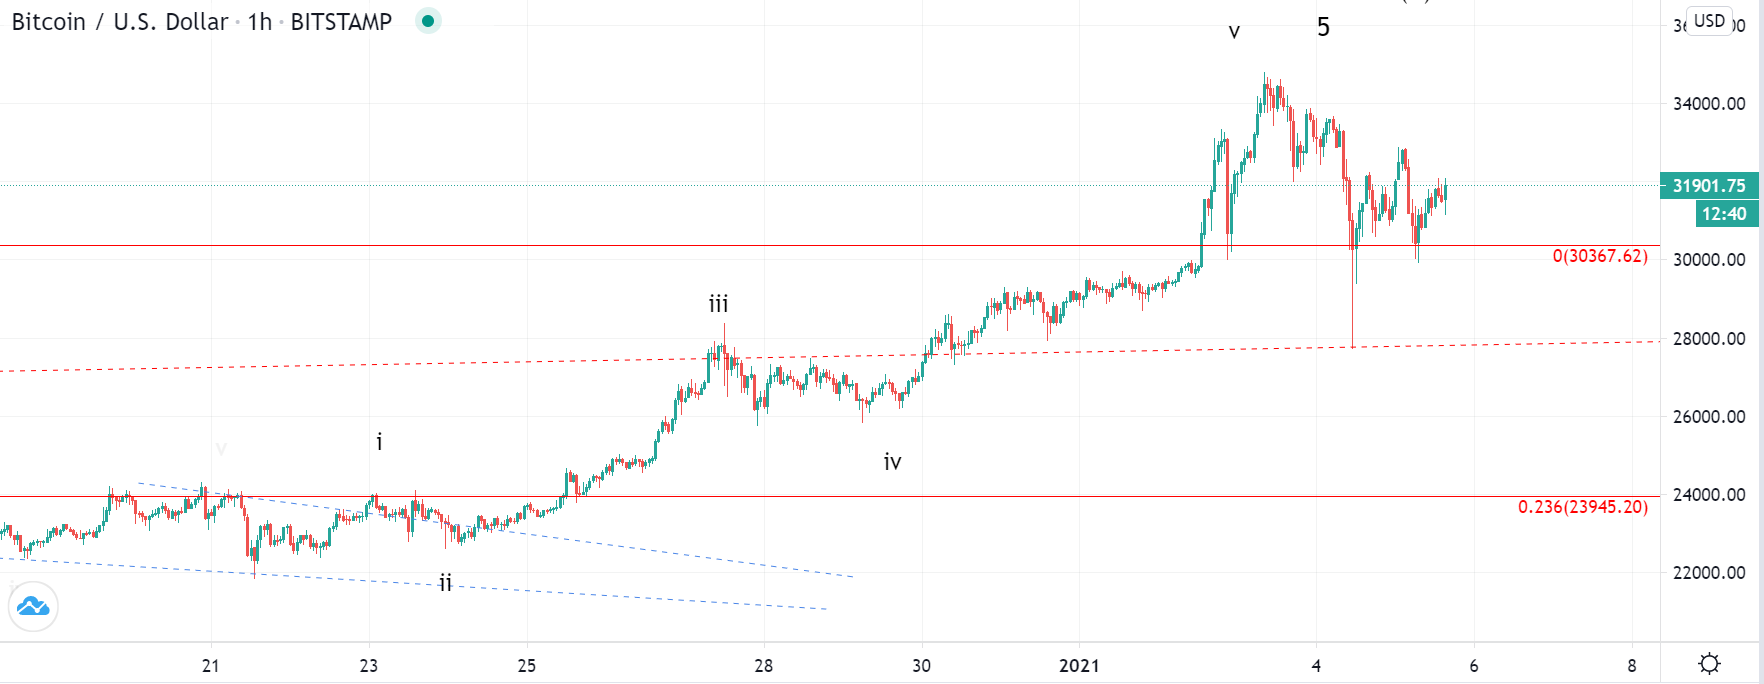
Looking at the hourly chart, we can see that the price completed another five-wave impulse to the upside that started on the 21st of December. This rise was most likely the ending wave of the higher degree count which is why now we are seeing some consolidation. The price action may continue to move sideways for some time now but if the 5th wave of a higher degree is in, then the price is now likely to decline further in a corrective manner.
From Sunday’s high, we have seen a three-wave decrease which could have been a local correction which would mean that another minor higher high could come, but in that case, the current move should be the developing lower degree impulse which doesn’t look like one. This is why it is more likely that now we are seeing a corrective increase before further impulsive moves to the downside.
XRP/USD
The price of Ripple has been in a recovery attempt since the 29th of December when it fell to the $0.18 area, but it hasn’t moved that much to the upside, only reaching $0.2588 on yesterday’s high. Since then another move to the downside was made to around $0.225 level, slightly above which it is currently being traded.
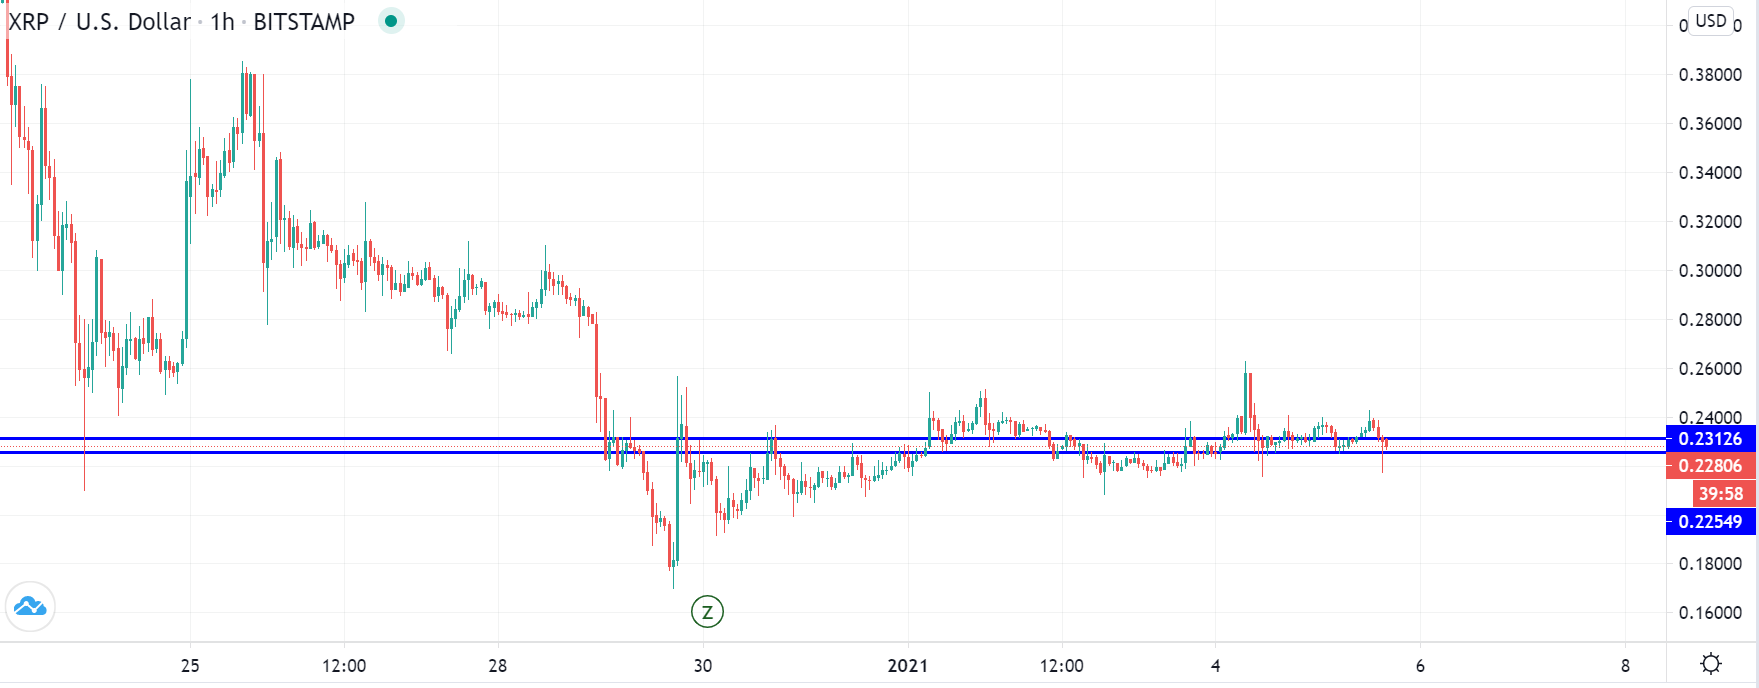
On the hourly chart, you can see that the price of Ripple is moving around its significant horizontal support zone as its attempting to establish support. This lookout for support is being made after a sharp and impulsive decline ended which was the Z wave from the complex correction count.
This is why now another wave to the upside is to start, but it is still uncertain whether or not it’s going to be an impulsive move or another corrective increase before a further decline. Considering the amount of decrease we have seen prior it is more likely that the price is now going to make a recovery but the bearish sentiment is still holding it behind the general market. This is why the price now has to establish a new bottom, potentially revisiting the lower range of the support zone in order to activate buying and chasing of the price that could cause a recovery.
FXOpen offers the world's most popular cryptocurrency CFDs*, including Bitcoin and Ethereum. Floating spreads, 1:2 leverage — at your service. Open your trading account now or learn more about crypto CFD trading with FXOpen.
*At FXOpen UK and FXOpen AU, Cryptocurrency CFDs are only available for trading by those clients categorised as Professional clients under FCA Rules and Professional clients under ASIC Rules respectively. They are not available for trading by Retail clients.
This article represents the opinion of the Companies operating under the FXOpen brand only. It is not to be construed as an offer, solicitation, or recommendation with respect to products and services provided by the Companies operating under the FXOpen brand, nor is it to be considered financial advice.
Latest from Cryptocurrencies
Latest articles

What Order Imbalance Is and How To Use It in a Trading Strategy
Understanding the nuances of order imbalances is key for traders looking to navigate the ebb and flow of asset prices. Order imbalances provide a clear window into the supply and demand dynamics at play, offering strategic insights. This article delves

XAU/USD Gold Price Reaches an Important Resistance Zone
The XAU/USD gold chart today indicates that the historical record price of the metal is above USD 2,400 per ounce.
In addition to fears of a new round of inflation due to rising commodity prices, geopolitical tensions are

What Is a Break of Structure and How Can You Trade It?
In the ever-evolving world of Smart Money Concept (SMC) trading, a nuanced understanding of market dynamics is indispensable. This article explores the concept of Break of Structure (BOS), how to identify it, and its implications for trading strategies, setting traders