


FXOpen

BTC/USD
The price of Bitcoin has been moving sideways since the 1st of December when it reached a new all-time high, spiking above the $19,677 level. Since then we have seen the formation of a descending triangle with the price now going back to its support level and has been testing it for support once again. Currently, it is being traded at around $18,819.
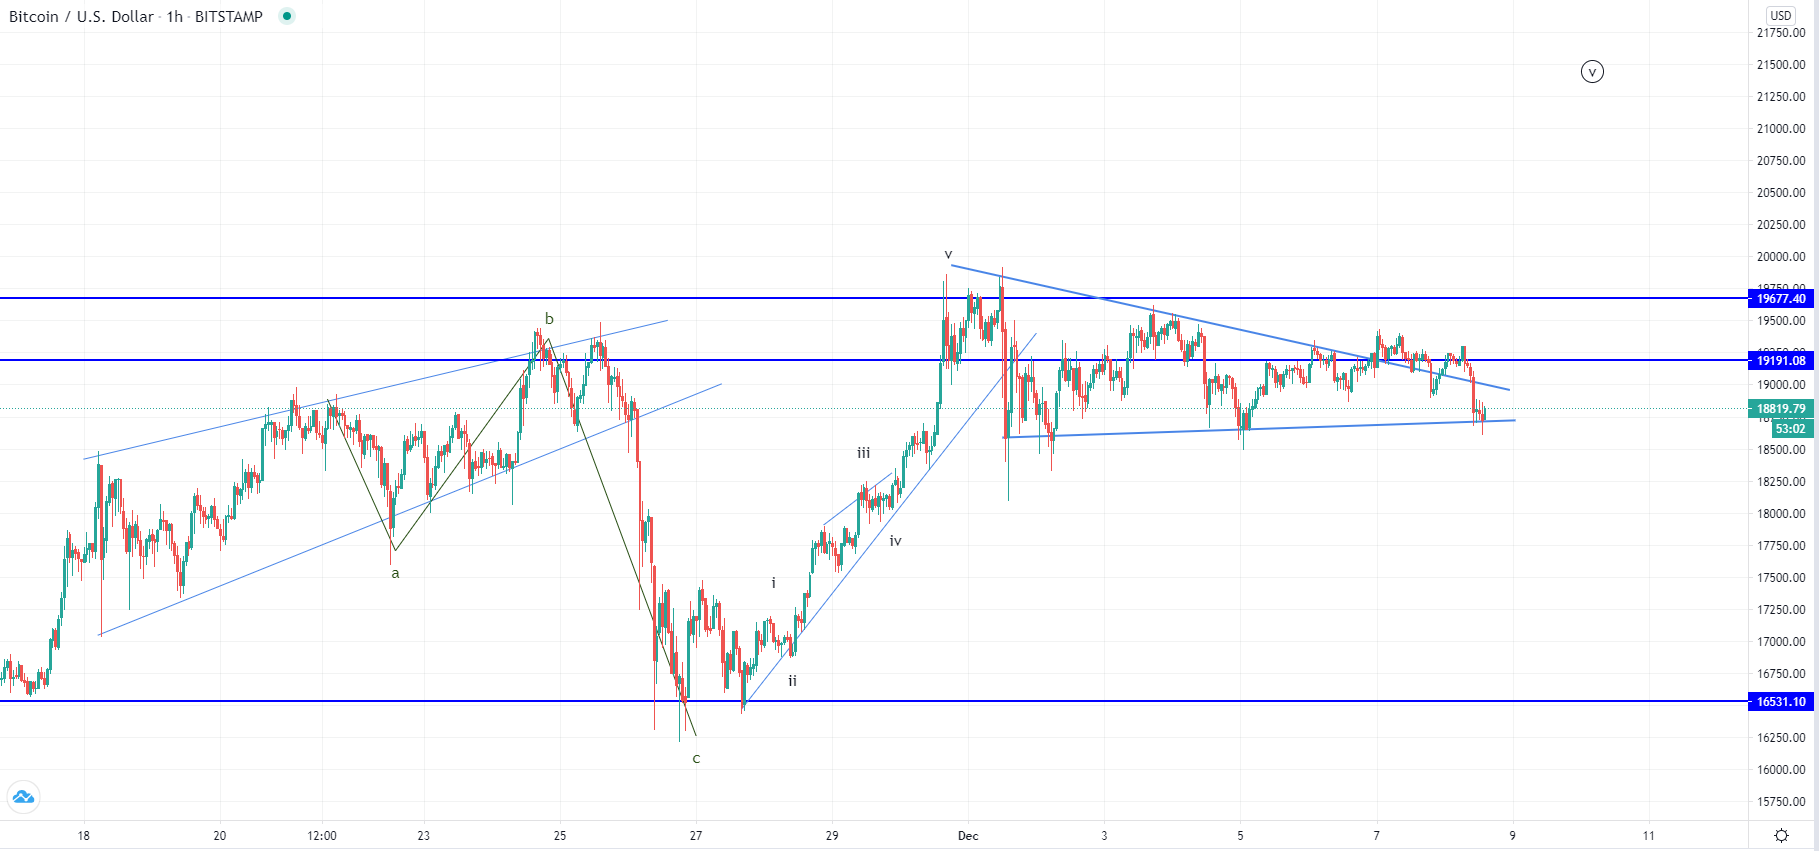
On the hourly chart, you can see that the price is finding support on the current interaction and has closed the hourly candle above it with now forming a green one. This could be an early indication that the price found support there and is now going to make a bounce. The triangle we have seen form could be the consolidative 4th wave out of the five-wave impulse to the upside that started on the 26th of November. In that case, after this sideways movement ends and it could have ended now on another support validation we are to see a breakout to the upside and an uptrend continuation. The price has already attempted a breakout but has been rejected slightly above the $19,380 level which is why we have seen a decrease. But if this a consolidation below the all-time high a breakout above the upper horizontal level would be seen for another higher high at around $21,230 area.
XRP/USD
From the 1st of December, the price of Ripple has decreased by around 20%, measured to its lowest point on the 5th, when it came down to $0.543 but started increasing from there again and came up to $0.625 on yesterday’s open. Now it is being traded slightly lower as another decrease was made but the price has made a higher low and a breakout from the higher degree symmetrical triangle on its upper side.
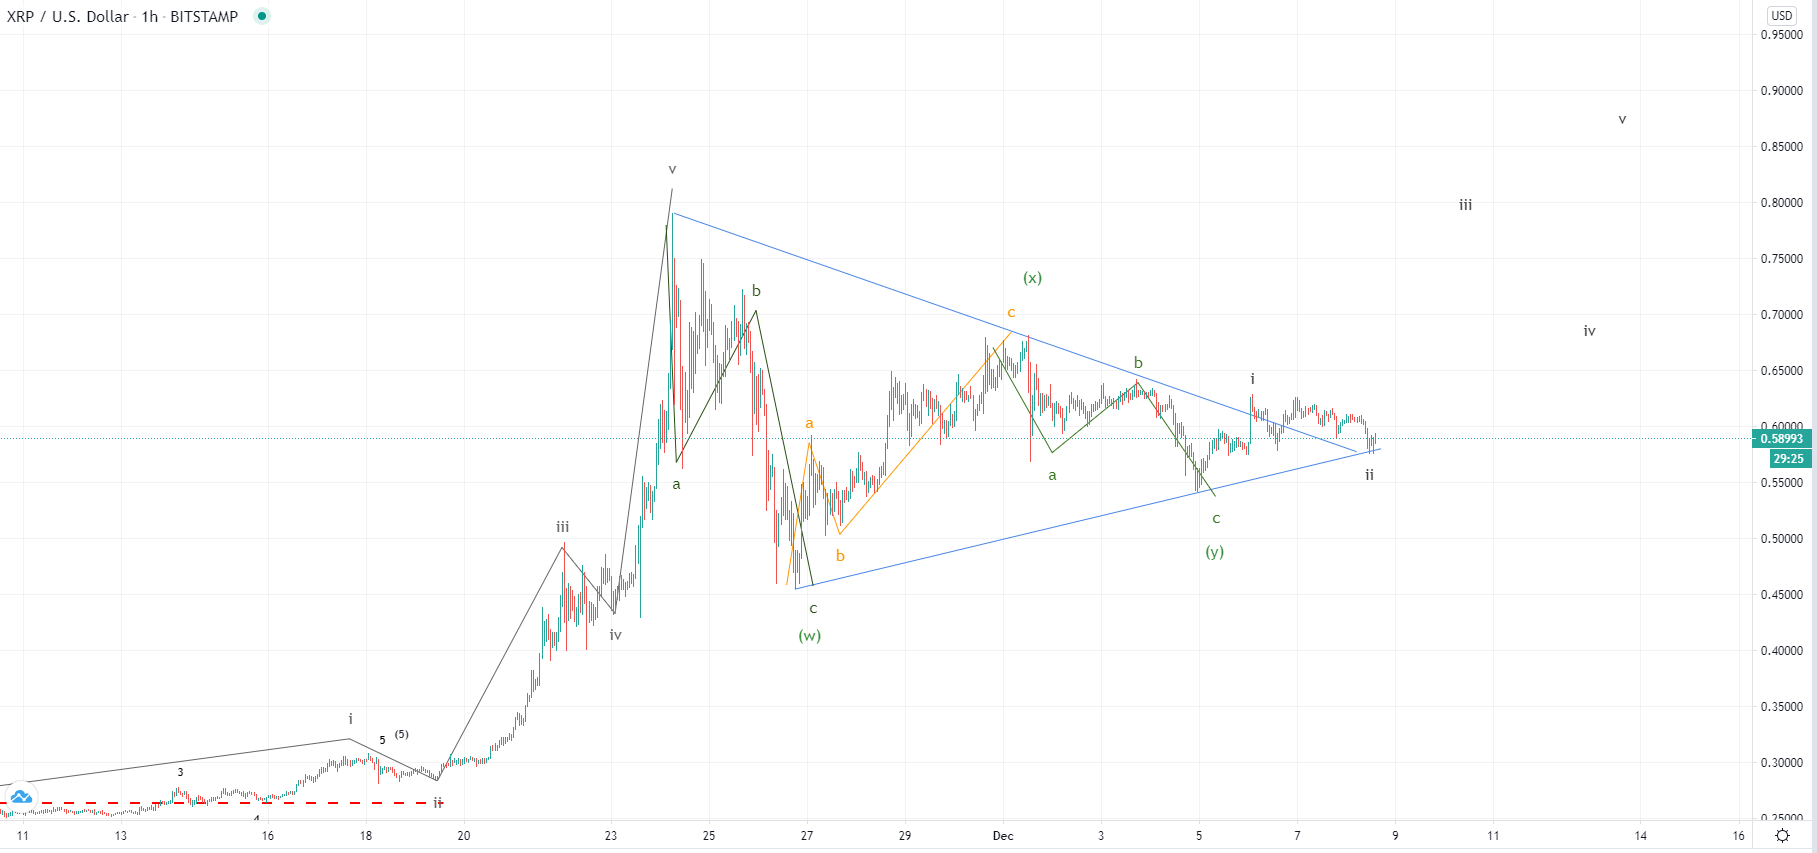
As you can see by looking at the hourly chart, the price made a breakout and a pullback to the support level of the symmetrical triangle where is now testing it for support. Like in the case of Bitcoin we could be seeing an early indication that the support is present at those levels as the hourly candle managed to close above it and now a green candle has started forming. If this was the 2nd wave out of the next five-wave impulse after the WXY correction, then the price is now headed towards a higher high compared to the one made on the 24th of November.
FXOpen offers the world's most popular cryptocurrency CFDs*, including Bitcoin and Ethereum. Floating spreads, 1:2 leverage — at your service. Open your trading account now or learn more about crypto CFD trading with FXOpen.
*At FXOpen UK and FXOpen AU, Cryptocurrency CFDs are only available for trading by those clients categorised as Professional clients under FCA Rules and Professional clients under ASIC Rules respectively. They are not available for trading by Retail clients.
This article represents the opinion of the Companies operating under the FXOpen brand only. It is not to be construed as an offer, solicitation, or recommendation with respect to products and services provided by the Companies operating under the FXOpen brand, nor is it to be considered financial advice.
Latest from Cryptocurrencies
Latest articles

What Order Imbalance Is and How To Use It in a Trading Strategy
Understanding the nuances of order imbalances is key for traders looking to navigate the ebb and flow of asset prices. Order imbalances provide a clear window into the supply and demand dynamics at play, offering strategic insights. This article delves

XAU/USD Gold Price Reaches an Important Resistance Zone
The XAU/USD gold chart today indicates that the historical record price of the metal is above USD 2,400 per ounce.
In addition to fears of a new round of inflation due to rising commodity prices, geopolitical tensions are

What Is a Break of Structure and How Can You Trade It?
In the ever-evolving world of Smart Money Concept (SMC) trading, a nuanced understanding of market dynamics is indispensable. This article explores the concept of Break of Structure (BOS), how to identify it, and its implications for trading strategies, setting traders