


FXOpen
BTC/USD
From last Monday when the price of Bitcoin was sitting on $7580 at it’s lowest point we have seen an increase of 24.61% as it came to $9445 on Thursday. Since then we have seen the price in a retracement which was further developed as a sideways range. Yesterday the price came down close to the vicinity of the prior low and to $8523 at it’s lowest from where we have seen another increase of around 7% coming to $9128 but is currently being traded at around $9000.
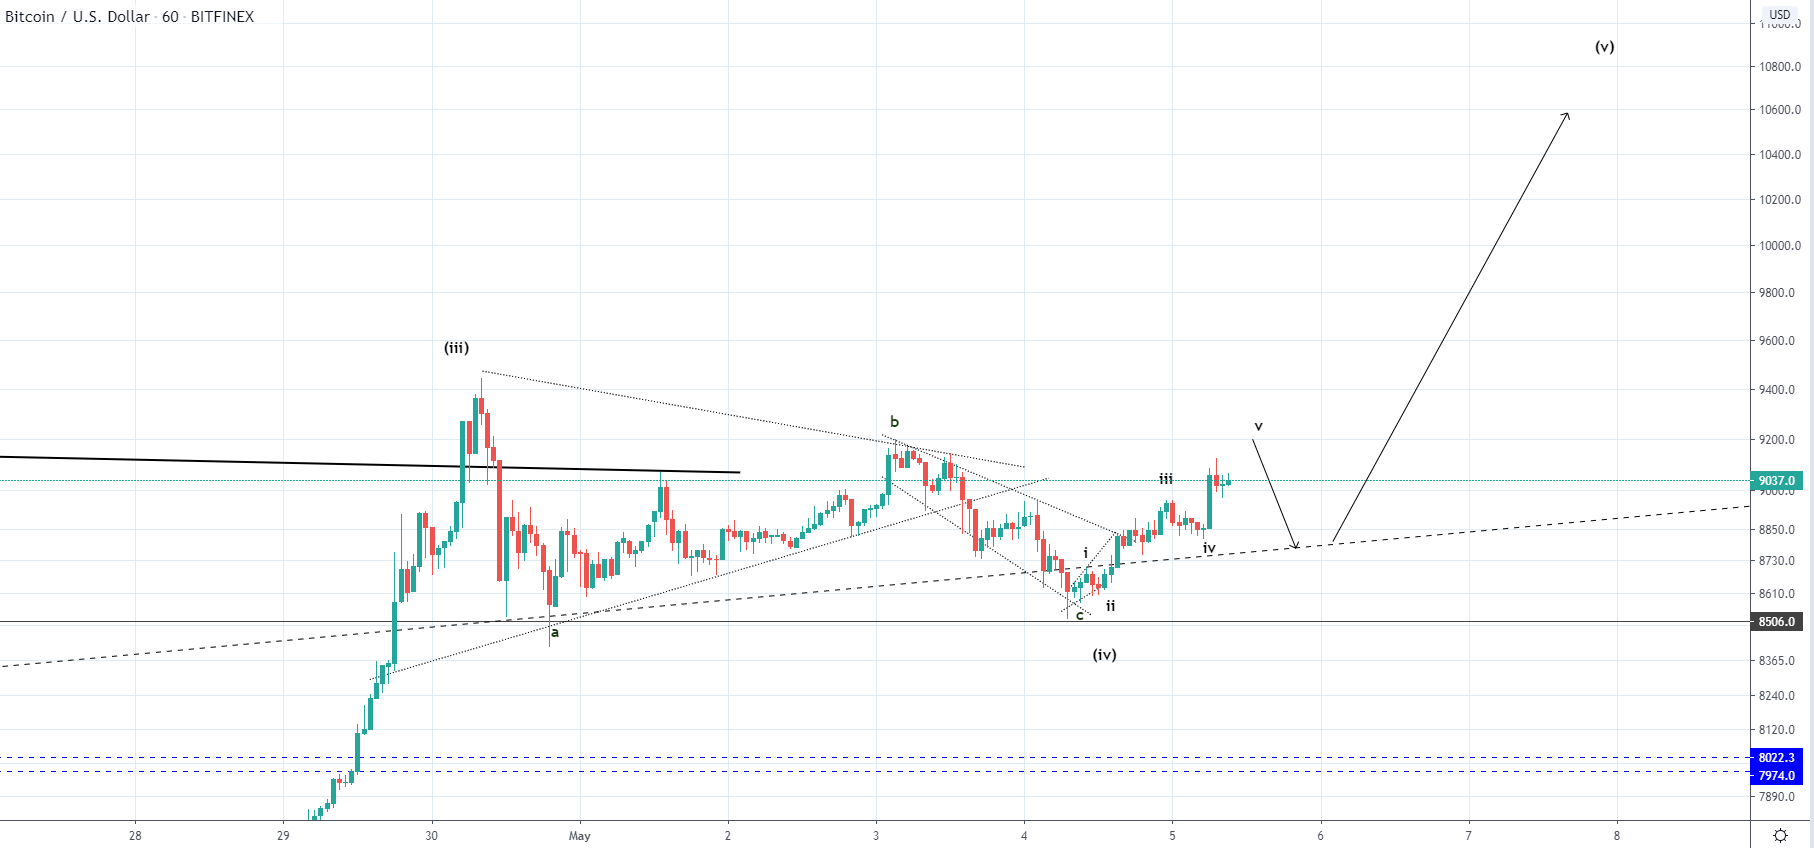 Looking at the hourly chart, we can see that from last week’s high the price has started forming a triangle in which it was bouncing with the current upside move coming again to its resistance level. As the previous downside move started to break its support level the current upside one could start to break it’s resistance one before another retracement occurs.
This triangle is most likely the 3rd wave to the upside from the higher degree five-wave impulse in which case the current upside move could be the start of the next one to the upside and would be its 1st sub-wave. If that is true then from last week’s high we have seen the completion of the ABC correction but another possibility could be that it is to be prolonged by 2 more waves.
If we see a retracement back to the interrupted ascending trendline where the price finds support and continues increasing impulsively again it would most likely indicate a proper breakout from the current range and the development of the 5th wave to the upside. But if the price continues moving to the vicinity of the prior low further sideways action could be seen before the uptrend continues.
XRP/USD
The price of Ripple has been following the same pattern as in the case of Bitcoin as we have seen an increase of 21.3% as it came up to $0.2357 on last Thursday from where we have seen the formation of the corrective triangle.
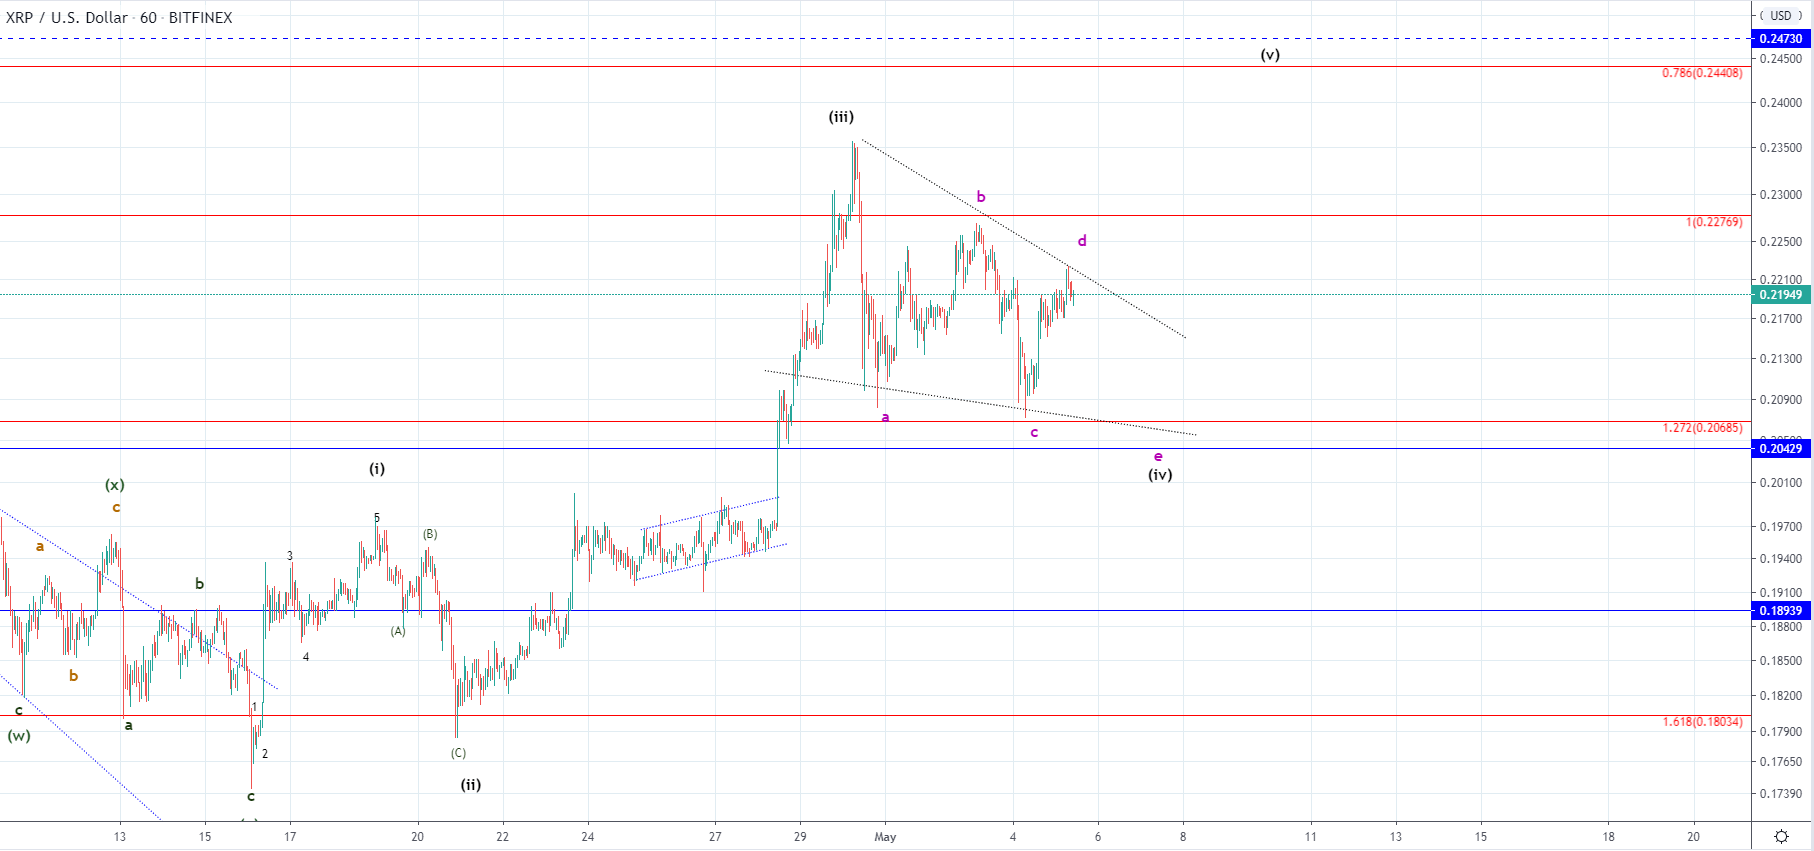 On the hourly chart, you can see that the price came up above the 1 Fibonacci level but immediately got back below it in an impulsive bearish manner as it previously entered the seller’s territory. From there we have seen two lower high with the price currently retesting the triangles resistance once again.
This is why I would be expecting another lower low before a breakout to the upside for the uptrend continuation potentially at the 0.786 Fib level which would bring the price of Ripple to $0.244.
FXOpen offers the world's most popular cryptocurrency CFDs*, including Bitcoin and Ethereum. Floating spreads, 1:2 leverage — at your service. Open your trading account now or learn more about crypto CFD trading with FXOpen.
*At FXOpen UK and FXOpen AU, Cryptocurrency CFDs are only available for trading by those clients categorised as Professional clients under FCA Rules and Professional clients under ASIC Rules respectively. They are not available for trading by Retail clients.
This article represents the opinion of the Companies operating under the FXOpen brand only. It is not to be construed as an offer, solicitation, or recommendation with respect to products and services provided by the Companies operating under the FXOpen brand, nor is it to be considered financial advice.
Latest articles

Anchored VWAP and How You Can Use It in Forex Trading
In the world of forex trading, understanding the nuanced tools at your disposal can significantly enhance decision-making processes. One such sophisticated tool is the Anchored Volume-Weighted Average Price (Anchored VWAP), which refines the standard VWAP by allowing traders to set

META Share Price Collapses after Publication of Quarterly Report
Just yesterday, META's stock price closed at USD 493.50, up approximately 40% since the start of 2024 and up nearly 300% since the start of 2023.
However, following the release of Meta's quarterly report, its shares plummeted to USD

USD/JPY Analysis: The Rate Exceeds The Level of 155 Yen Per US Dollar
Today, the price of USD/JPY once again renewed its 34-year high, exceeding the level of 155 yen per dollar, which put pressure on the current authorities.
According to Reuters, officials are trying to maintain calm in the market.
"We