


FXOpen
The price of Bitcoin reached $59,544 at its highest point yesterday from its prior higher low of $53,170 on the 5th of May. This rise of 12.24% was stopped as the third unsuccessful attempt to surpass the zone above the $60,000 which is why we have seen a decrease of 10% measured to its lowest spike of $53,530. Currently, the price is being traded at around $55,440 as it managed to snap back quickly up above the significant horizontal level.
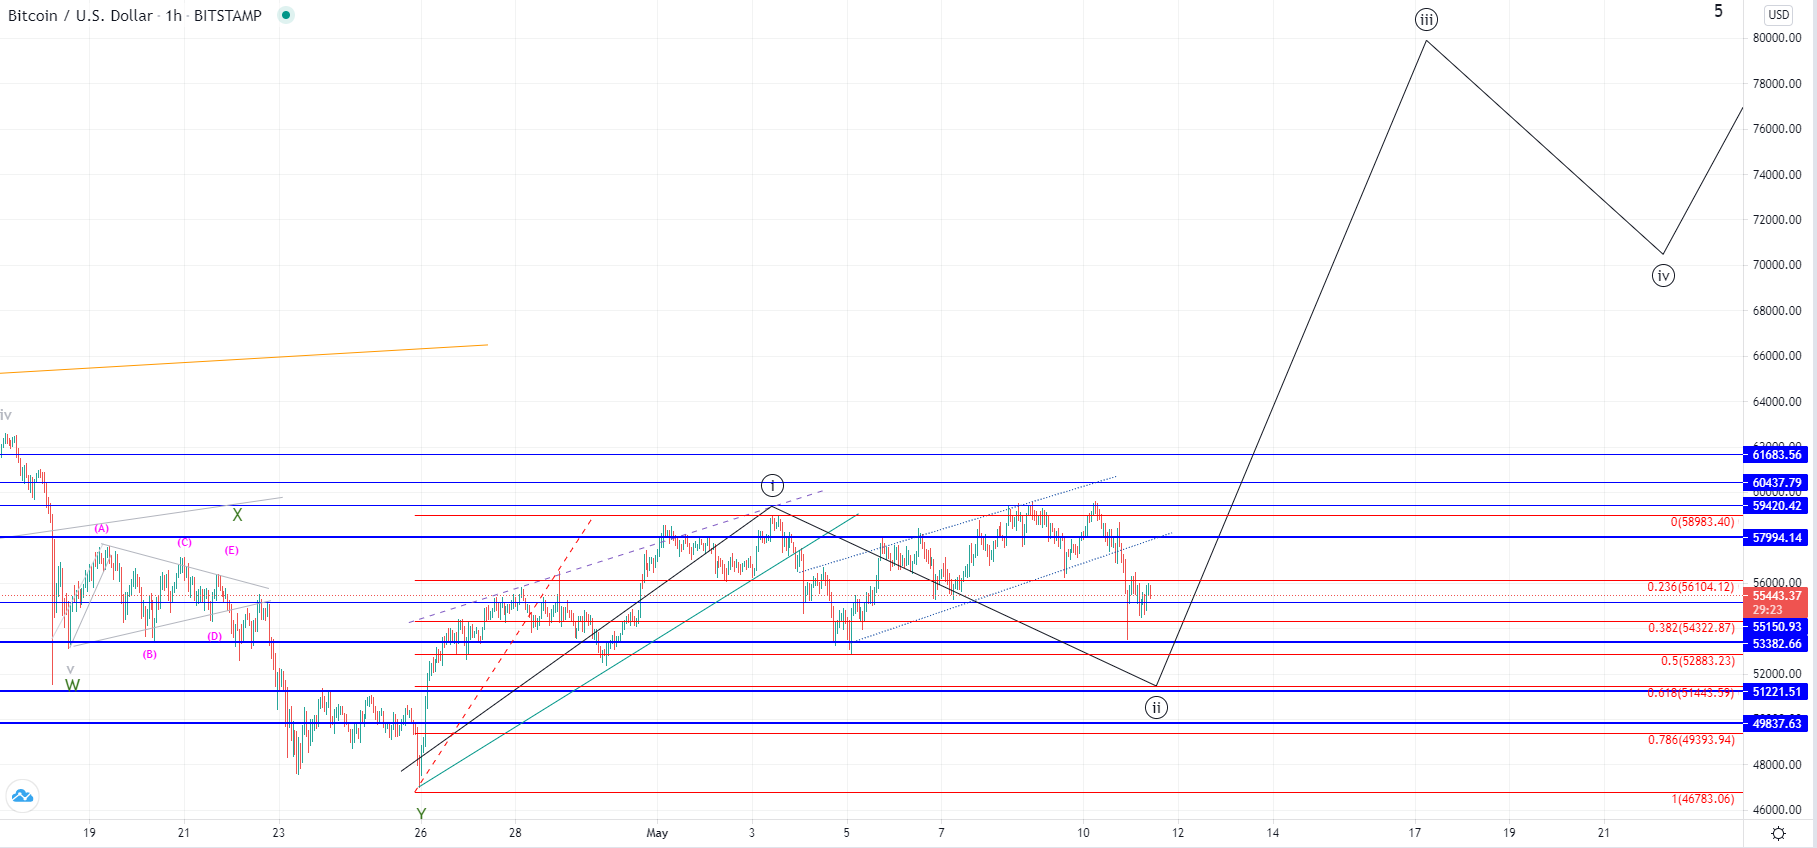
Now the price is looking for support as the breakout momentum has been seen strong. The descending move is counted as the second sub-wave of the higher degree count out of which further upside would be expected. However, we need to first see the price to hold above the $55,200 area for the scenario to still be valid. If the price goes below it, that would be an early indication that we are seeing further lows before another upward cycle.
The primary count implies that from the 26th of April we have seen another wave to the upside and it is still unclear where this current descending move belongs, but if it’s the part of the higher degree correction it could end below $53,400.
XRP/USD
The price of Ripple has been declining from the 6th of May when it reached $1.758 at its highest point. It made a decrease of 29.6% to its lowest wick today at around $1.2298 but it’s currently being traded at $1.42.
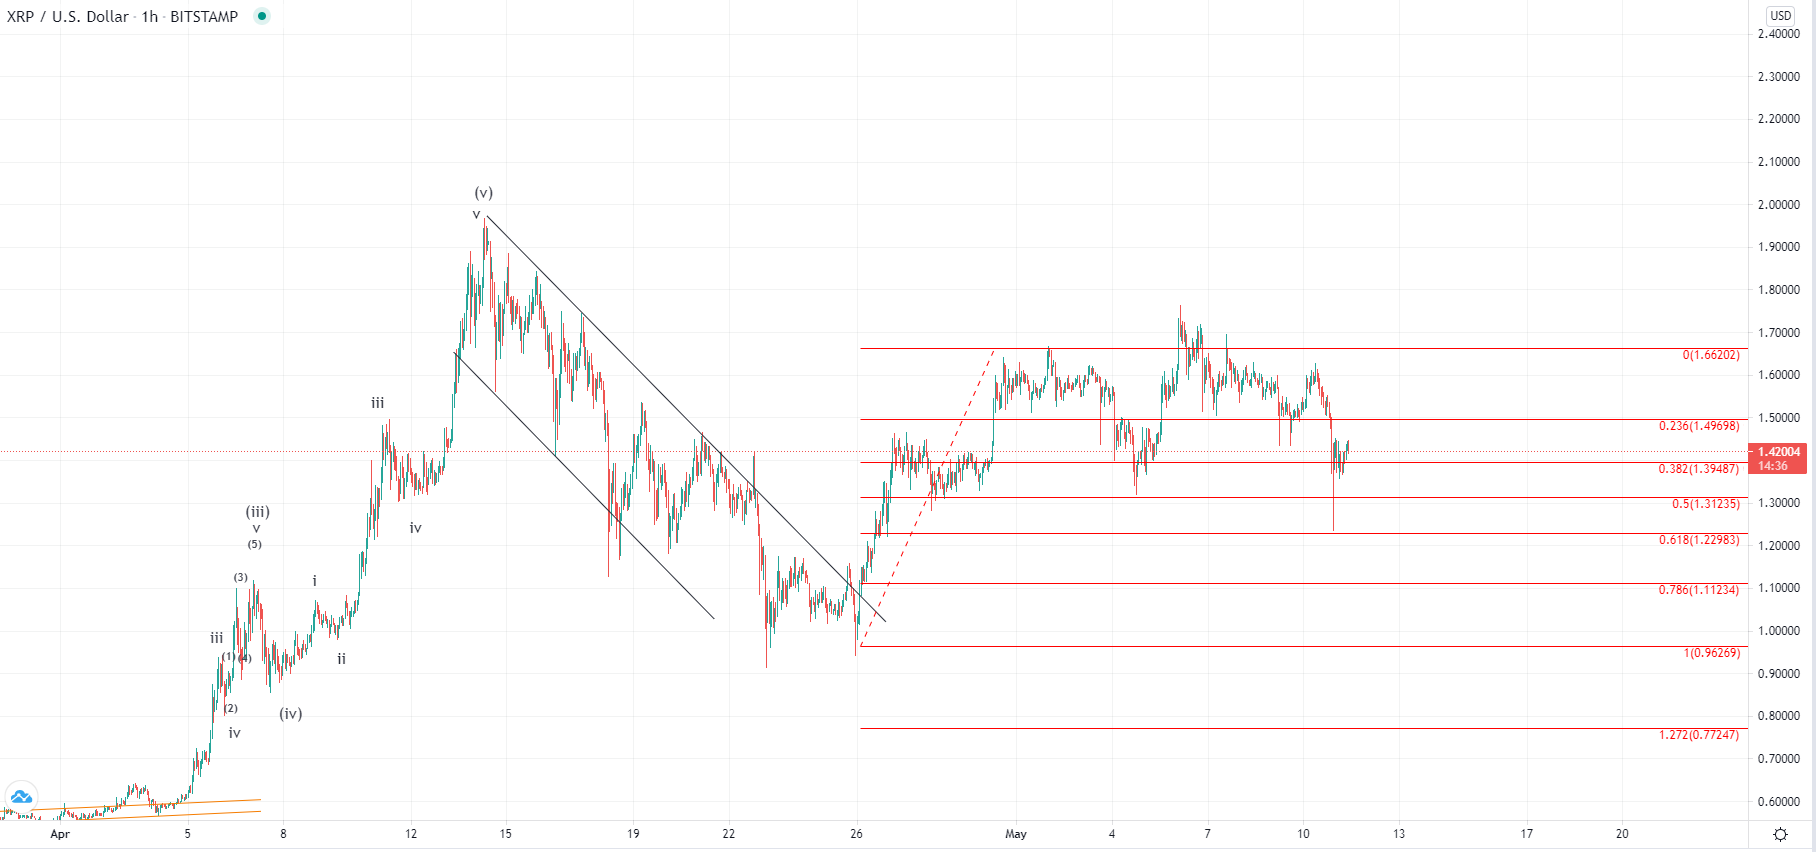
On the hourly chart, you can see that the price fell back to the 0.618 Fibonacci level but is currently being traded above 0.382. This is a bullish sign as we can interpret it as buyers’ pressure. If we have seen the end of the corrective move on the 26th of April this would mean that the price increase to the 6th of May was the first wave out of the next impulsive move to the upside. In that case, the retracement we have seen from $1.75 is the 2nd sub-wave of the five-wave impulse to the upside and is why we could immediately see the start of the next uptrend.
But first we need to see where the price can finds support as another lower low could be seen from here. Considering a wick to the 0.618 was made it could indicate that the price is headed further toward that area which would bring the price down to $1.2 area. In the case that we see the price fall below the start of the prior upward move at around $0.963 it would invalidate the count.
This forecast represents FXOpen Markets Limited opinion only, it should not be construed as an offer, invitation or recommendation in respect to FXOpen Markets Limited products and services or as financial advice. Cryptocurrency CFDs are not available to trade in all jurisdictions.
FXOpen offers the world's most popular cryptocurrency CFDs*, including Bitcoin and Ethereum. Floating spreads, 1:2 leverage — at your service. Open your trading account now or learn more about crypto CFD trading with FXOpen.
*At FXOpen UK and FXOpen AU, Cryptocurrency CFDs are only available for trading by those clients categorised as Professional clients under FCA Rules and Professional clients under ASIC Rules respectively. They are not available for trading by Retail clients.
This article represents the opinion of the Companies operating under the FXOpen brand only. It is not to be construed as an offer, solicitation, or recommendation with respect to products and services provided by the Companies operating under the FXOpen brand, nor is it to be considered financial advice.
Latest from Cryptocurrencies
Latest articles

Since the Start of the Week, Brent Oil Price Has Dropped over 4%
At the beginning of the week, March 15, we wrote that the price of Brent oil could form a correction from the resistance level of USD 91 per barrel. Since then, the price has decreased by more than 4% due

Fair Value Gaps vs Liquidity Voids in Trading
Understanding fair value gaps and liquidity voids is essential for traders seeking to navigate the complexities of the financial markets. These concepts, deeply rooted in the Smart Money Concept (SMC), provide valuable insights into the dynamics of supply and demand,

UK100 Share Index Rises as UK Inflation Slows
Yesterday, the UK Office for National Statistics (ONS) reported that the CPI stood at 3.2% in March. According to ForexFactory, analysts expected 3.1%, and a month ago the index was 3.4%.
Grant Fitzner, chief economist at the