


FXOpen
BTC/USD
The price of Bitcoin has been moving sideways from the 17th of March when it came up to $59,600 until the 20th when it paid another revisit to those levels. However, after a failure to break the $60,000 mark to the upside we have seen a rejection that caused a breakout from the symmetrical triangles and a low to $52,924.
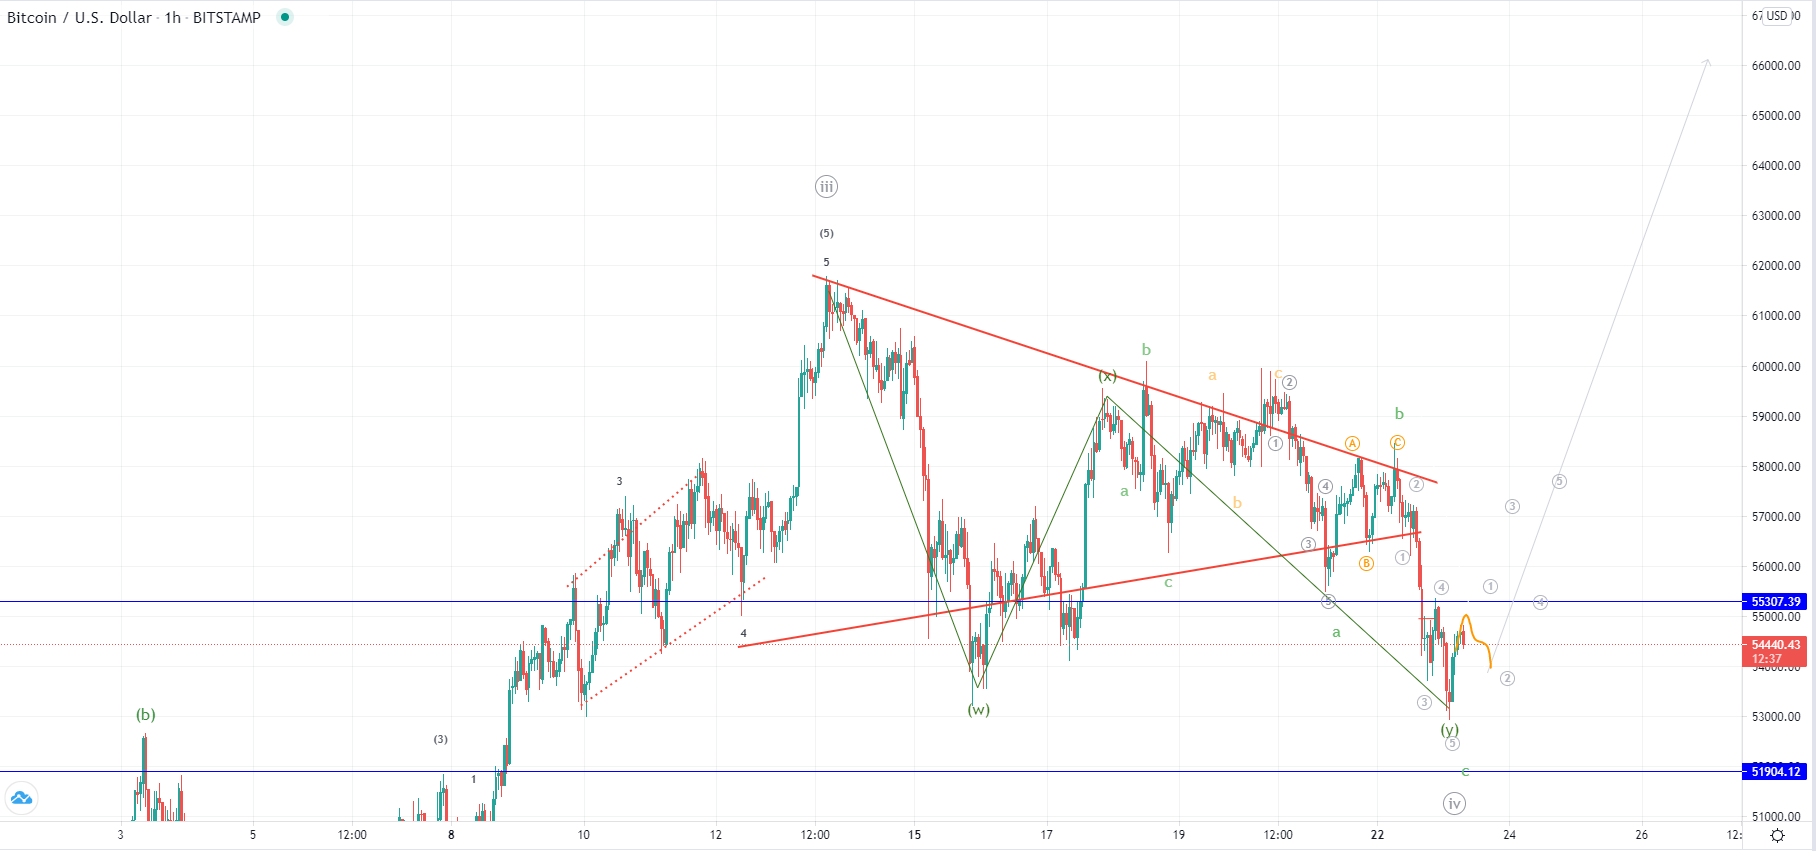
Now we are seeing a minor recovery with the price currently being traded at $54,528 and has bounced nicely forming a V shape. The descending move was a five-wave impulse which is why we could have seen the completion of the WXY correction.
In that case, the price is now making its first attempts to establish an uptrend as the 1st wave from the next impulsive wave to the upside started. However, there could still be a possibility of another lower low to the significant $51,940 level.
If we have seen the completion of the 4th wave correction, then the price of Bitcoin is now headed towards the new all-time high, potentially in the zone between $72,000 and $68,000.
XRP/USD
The price of Ripple has been on the rise from the 18th of March when it was sitting at around $0.464 at its lowest point. From there we have seen a breakout from the symmetrical triangle in which it was forming from the 1st of February. We have seen the price reaching $0.6 before falling back to the $0.54 area and is currently sitting at $0.56612.
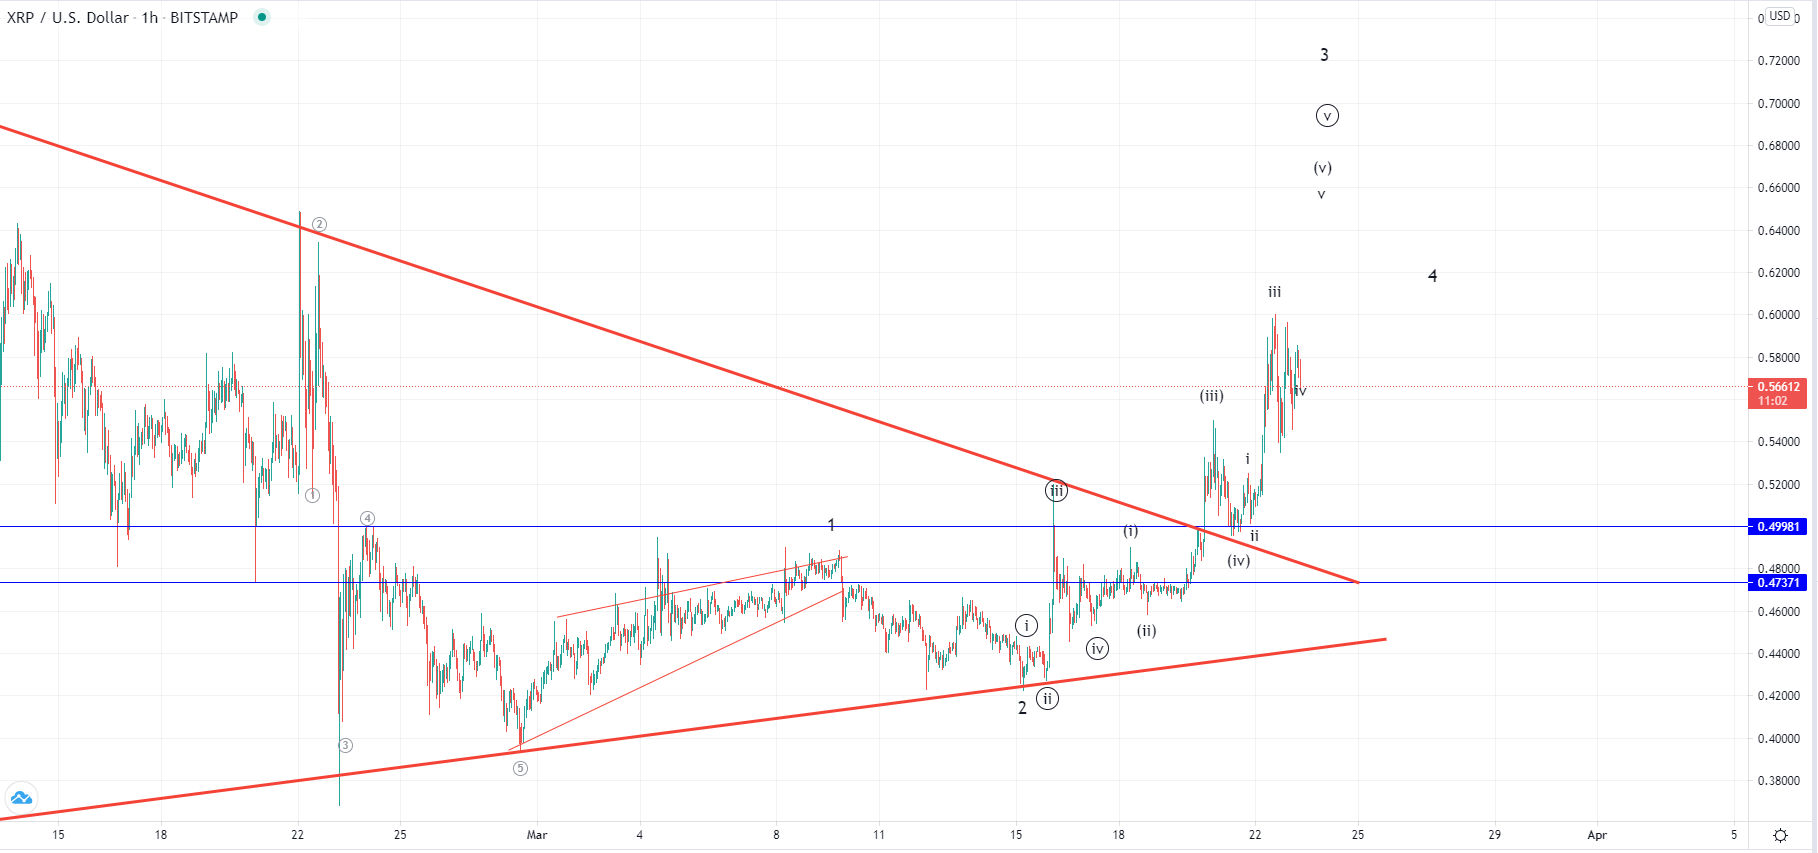
This sideways movement from yesterday’s high is the 4th wave out of the next impulse wave to the upside which is why after its completion another rise to the $0.66 level would be likely. We have seen the formation of the symmetrical triangle so the breakout is equally possible but considering the bullish momentum, it is more likely that it would continue moving forward. If this is the 3r wave of the higher degree impulse wave then the price of Ripple is set to move much higher and surpass its February’s high of $0.75. This would be re-evaluated after the completion of the currently expected rise and the pullback that is supposed to follow afterward.
If we see the price staying above the $0.62 level it cold be an early indication that the price is headed further up.
This forecast represents FXOpen Markets Limited opinion only, it should not be construed as an offer, invitation or recommendation in respect to FXOpen Markets Limited products and services or as financial advice.
Cryptocurrency CFDs are not available to trade in all jurisdictions.
FXOpen offers the world's most popular cryptocurrency CFDs*, including Bitcoin and Ethereum. Floating spreads, 1:2 leverage — at your service. Open your trading account now or learn more about crypto CFD trading with FXOpen.
*At FXOpen UK and FXOpen AU, Cryptocurrency CFDs are only available for trading by those clients categorised as Professional clients under FCA Rules and Professional clients under ASIC Rules respectively. They are not available for trading by Retail clients.
This article represents the opinion of the Companies operating under the FXOpen brand only. It is not to be construed as an offer, solicitation, or recommendation with respect to products and services provided by the Companies operating under the FXOpen brand, nor is it to be considered financial advice.
Latest from Cryptocurrencies
Latest articles

What Order Imbalance Is and How To Use It in a Trading Strategy
Understanding the nuances of order imbalances is key for traders looking to navigate the ebb and flow of asset prices. Order imbalances provide a clear window into the supply and demand dynamics at play, offering strategic insights. This article delves

XAU/USD Gold Price Reaches an Important Resistance Zone
The XAU/USD gold chart today indicates that the historical record price of the metal is above USD 2,400 per ounce.
In addition to fears of a new round of inflation due to rising commodity prices, geopolitical tensions are

What Is a Break of Structure and How Can You Trade It?
In the ever-evolving world of Smart Money Concept (SMC) trading, a nuanced understanding of market dynamics is indispensable. This article explores the concept of Break of Structure (BOS), how to identify it, and its implications for trading strategies, setting traders