


FXOpen
BTC/USD
The price of Bitcoins has been moving sideways in the last couple of days after it made a spike to the upside to $38,637 at its highest point. This increase of around 31.9% came after the price tested the descending triangles support level and was the impulsive move that made a breakout from the triangles on the upside.
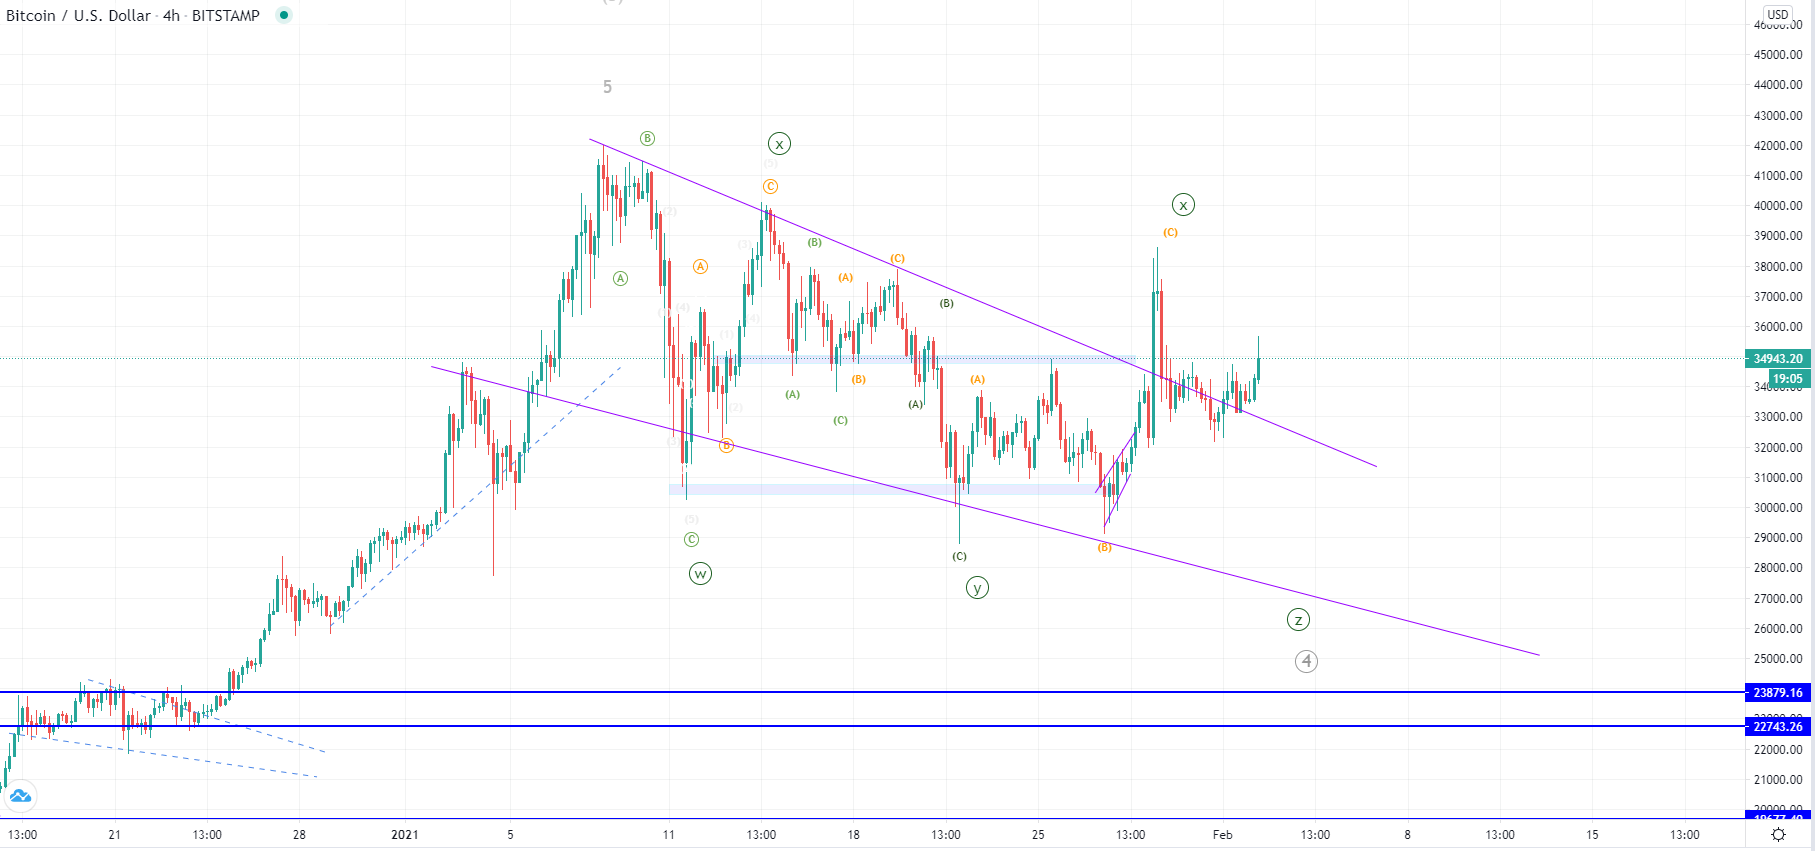
As you can see from the hourly chart after a breakout was made the price fell back and retested the triangle’s resistance level for support, which was a pullback to $32,213. Support was present at those levels which is why we have seen further increase but the price didn’t manage to move back up for a higher high compared to the local one.
Even though the breakout was made this increase could still be part of the same correctional structure that started on the 10th of January after the all-time high was made. If this is true then the price is now headed further down for the formation of the Z wave of the complex correction count.
Another possibility would be that the correction ended on the 27th of January in which case this impulse was to be the first wave from the next starting impulse. As the price is now in a downward trajectory we are going to see which count gets validated. If the price continues moving down and enters the territory of the descending triangle then it would be the first bearish one, but if it finds support and continues increasing, further price appreciation would look more likely.
XRP/USD
The price of Ripple has spiked to the $0.755 level yesterday coming from $0.3895 at its lowest point on Sunday, which was an increase of 93.84%. But after the increase ended the price was set in a downfall of 54%, coming to $0.3465 at its lowest point today. Since then recovery has been seen with the price moving sharply to the upside and is currently being traded just slightly below the $0.4 level.
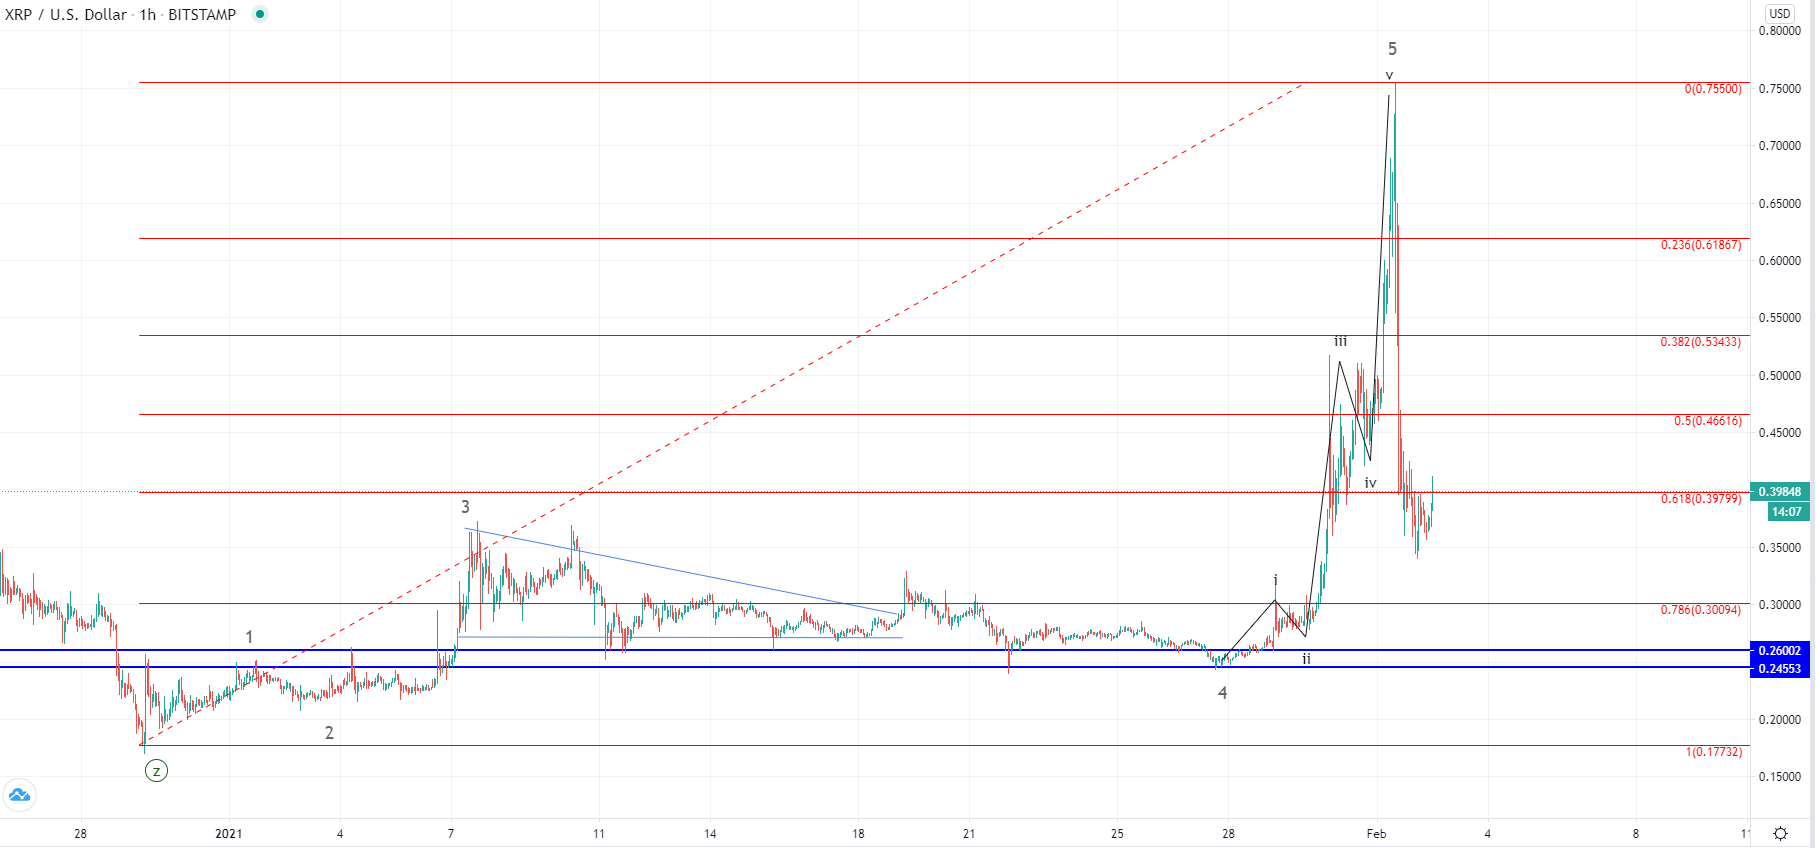
On the hourly chart, you can see that the price fell below the 0.618 Fibonacci level but now managed to pull back above it. The previous upside move was the ending of the five-wave impulse that started before the new year which is why we have seen a retracement. If this impulse was the first wave after the larger correction ended, the price of Ripple is now headed further to the upside but considering the amount of the decrease we have seen since yesterday we are yet to see if the bullish interest is still present.
This forecast represents FXOpen Markets Limited opinion only, it should not be construed as an offer, invitation or recommendation in respect to FXOpen Markets Limited products and services or as financial advice.
Cryptocurrency CFDs are not available to trade in all jurisdictions.
FXOpen offers the world's most popular cryptocurrency CFDs*, including Bitcoin and Ethereum. Floating spreads, 1:2 leverage — at your service. Open your trading account now or learn more about crypto CFD trading with FXOpen.
*At FXOpen UK and FXOpen AU, Cryptocurrency CFDs are only available for trading by those clients categorised as Professional clients under FCA Rules and Professional clients under ASIC Rules respectively. They are not available for trading by Retail clients.
This article represents the opinion of the Companies operating under the FXOpen brand only. It is not to be construed as an offer, solicitation, or recommendation with respect to products and services provided by the Companies operating under the FXOpen brand, nor is it to be considered financial advice.
Latest articles

Anchored VWAP and How You Can Use It in Forex Trading
In the world of forex trading, understanding the nuanced tools at your disposal can significantly enhance decision-making processes. One such sophisticated tool is the Anchored Volume-Weighted Average Price (Anchored VWAP), which refines the standard VWAP by allowing traders to set

META Share Price Collapses after Publication of Quarterly Report
Just yesterday, META's stock price closed at USD 493.50, up approximately 40% since the start of 2024 and up nearly 300% since the start of 2023.
However, following the release of Meta's quarterly report, its shares plummeted to USD

USD/JPY Analysis: The Rate Exceeds The Level of 155 Yen Per US Dollar
Today, the price of USD/JPY once again renewed its 34-year high, exceeding the level of 155 yen per dollar, which put pressure on the current authorities.
According to Reuters, officials are trying to maintain calm in the market.
"We