


FXOpen
BTC/USD
From yesterday’s low at $4472 the price of Bitcoin has increased by 21.5% as it came up to $5435 at it’s highest point today. The price is currently being traded slightly below those levels as it encountered horizontal resistance but is still in an upward trajectory overall.
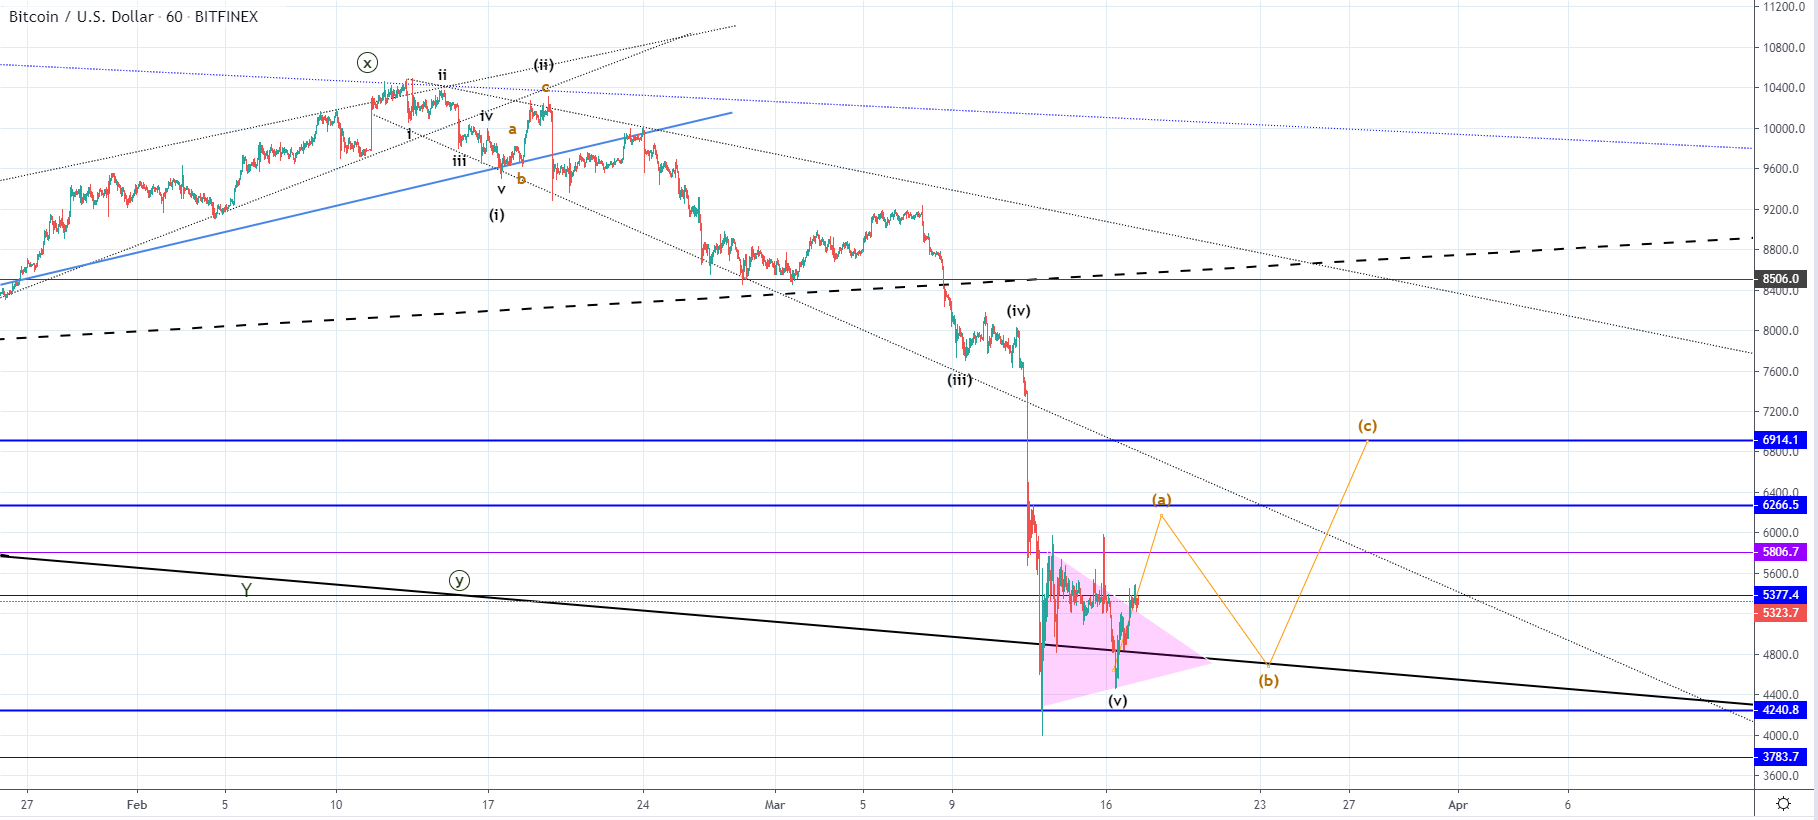 On the hourly chart, you can see that the price of Bitcoin has been looking for support at the descending trendline (bold black line) which is the support baseline from the first corrective decrease in June last year. As this level got retested and the price didn’t go below it on an impulsive decrease and again attempted a breakout but failed we can say that the price found support there.
However, it hasn’t made any higher highs since then as it was stopped out by the $5377 level which is currently rejecting the price. This might not continue for much longer as the recovery is likely to continue above the level as indicated by the bullish momentum which is catching on but the expected recovery would be a corrective one.
The decrease in price which Bitcoin experienced pushed the price below the most significant horizontal level at $6266 which is considered a Pivot point above which we could be seeing a bull market and below which we are seeing the bear one. As this level hasn’t been properly tested after a move below it in the upcoming period I would be expecting it retested.
XRP/USD
The price of Ripple has increased by 18.2% from yesterday’s low at $0.1289 to $0.15224 at it’s highest today. Like in the case of Bitcoin the increase has been stopped out at the first horizontal resistance in line to the upside but the bullish momentum is likely to continue. 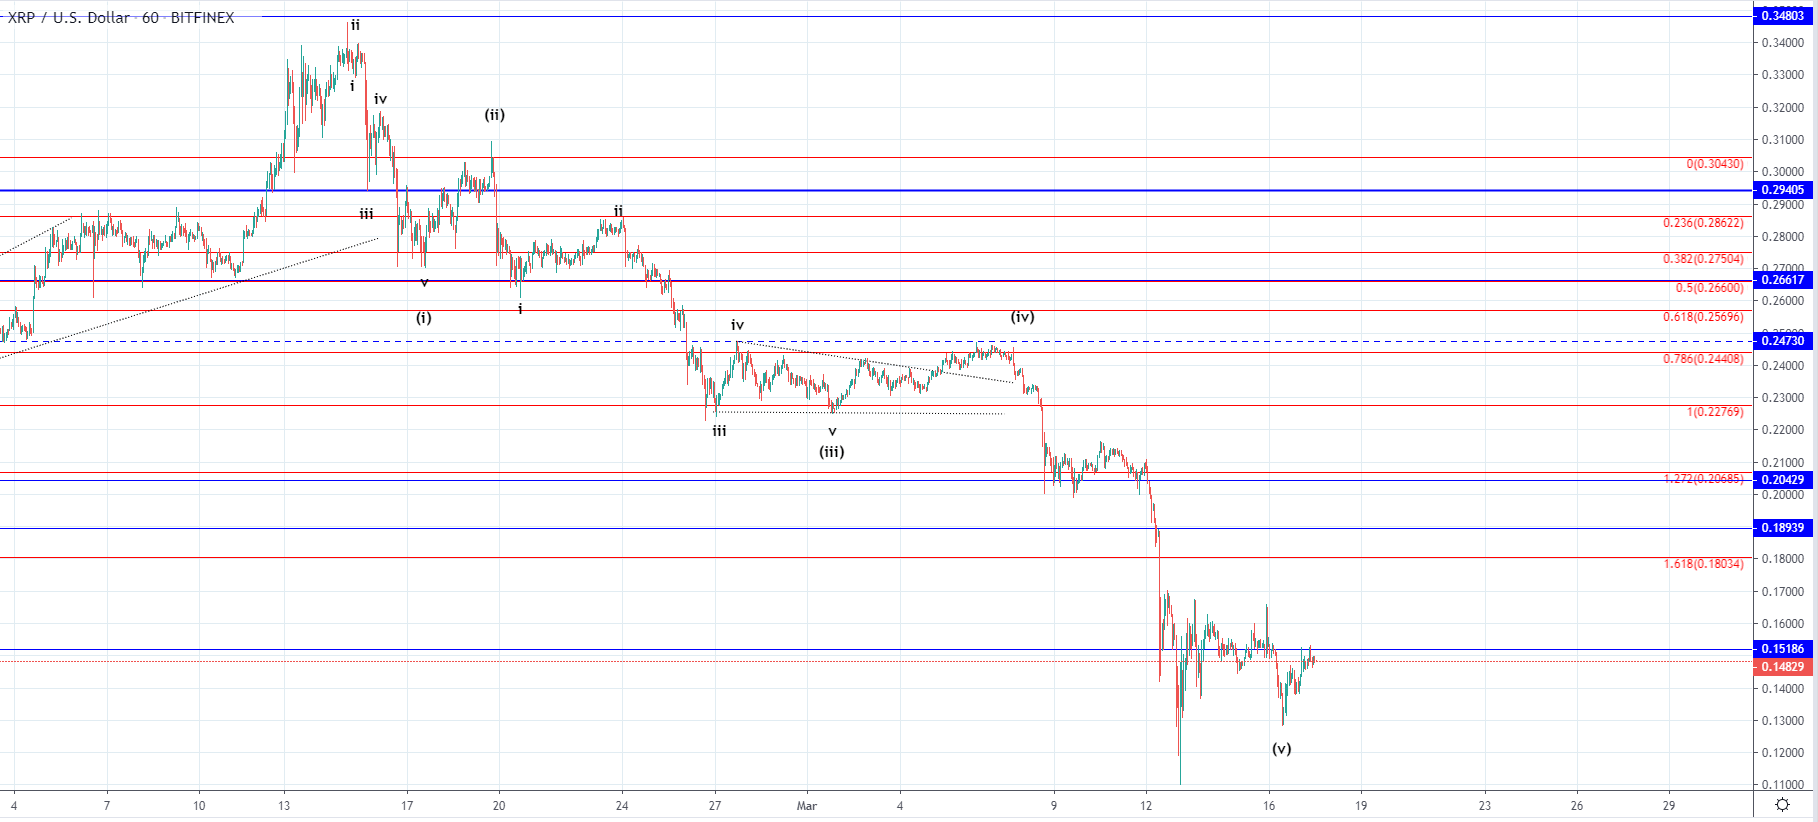 Looking at the hourly chart we can see that the decrease made below the $0.15186 level was, after all, a five-wave impulse and not an ABC correction which means that it now most likely ended on yesterday’s low. This is why now I would be expecting a recovery but only a corrective one as this five-wave impulse to the downside could be the A wave of a higher degree.
If the price continues moving above the currently found resistance which I believe that it will we are likely to see an interaction with the 1.272 Fib level at around $0.2 as this was the most significant horizontal level to the downside and its retest for resistance is to occur before further downside movement.
FXOpen offers the world's most popular cryptocurrency CFDs*, including Bitcoin and Ethereum. Floating spreads, 1:2 leverage — at your service. Open your trading account now or learn more about crypto CFD trading with FXOpen.
*At FXOpen UK and FXOpen AU, Cryptocurrency CFDs are only available for trading by those clients categorised as Professional clients under FCA Rules and Professional clients under ASIC Rules respectively. They are not available for trading by Retail clients.
This article represents the opinion of the Companies operating under the FXOpen brand only. It is not to be construed as an offer, solicitation, or recommendation with respect to products and services provided by the Companies operating under the FXOpen brand, nor is it to be considered financial advice.
Latest articles

Google Share Price Rose Post-market to a New All-time Record
Yesterday, after the close of the main trading session, a report on activities for the 1st quarter of Alphabet Inc. (Google's parent company) was published. The report was strong, exceeding investors' expectations.
→ Quarterly EPS = USD 1.89 (expected = USD 1.

S&P 500 Rebounds after Negative GDP News
Data released yesterday showed US GDP growth slowed to 1.6% in the first quarter of the year. According to ForexFactory: forecast = 2.2%, past value = 2.4%.
Reaction to the news sent the S&P 500 mini stock

GBP/USD And USD/CAD Daily Chart Outlook
GBP/USD is attempting a recovery wave from 1.2300. USD/CAD is consolidating and might aim for a move above the 1.3760 resistance zone.
Important Takeaways for GBP/USD and USD/CAD Analysis Today
· The British Pound started