


FXOpen
BTC/USD
From yesterday’s open when the price of Bitcoin was sitting at $9988.8 which was it’s highest point, we have seen a decrease of 4.71% as the price came down to $9518 at it’s lowest point today. Currently, the price is hovering around those levels and is sitting slightly higher at around $9564.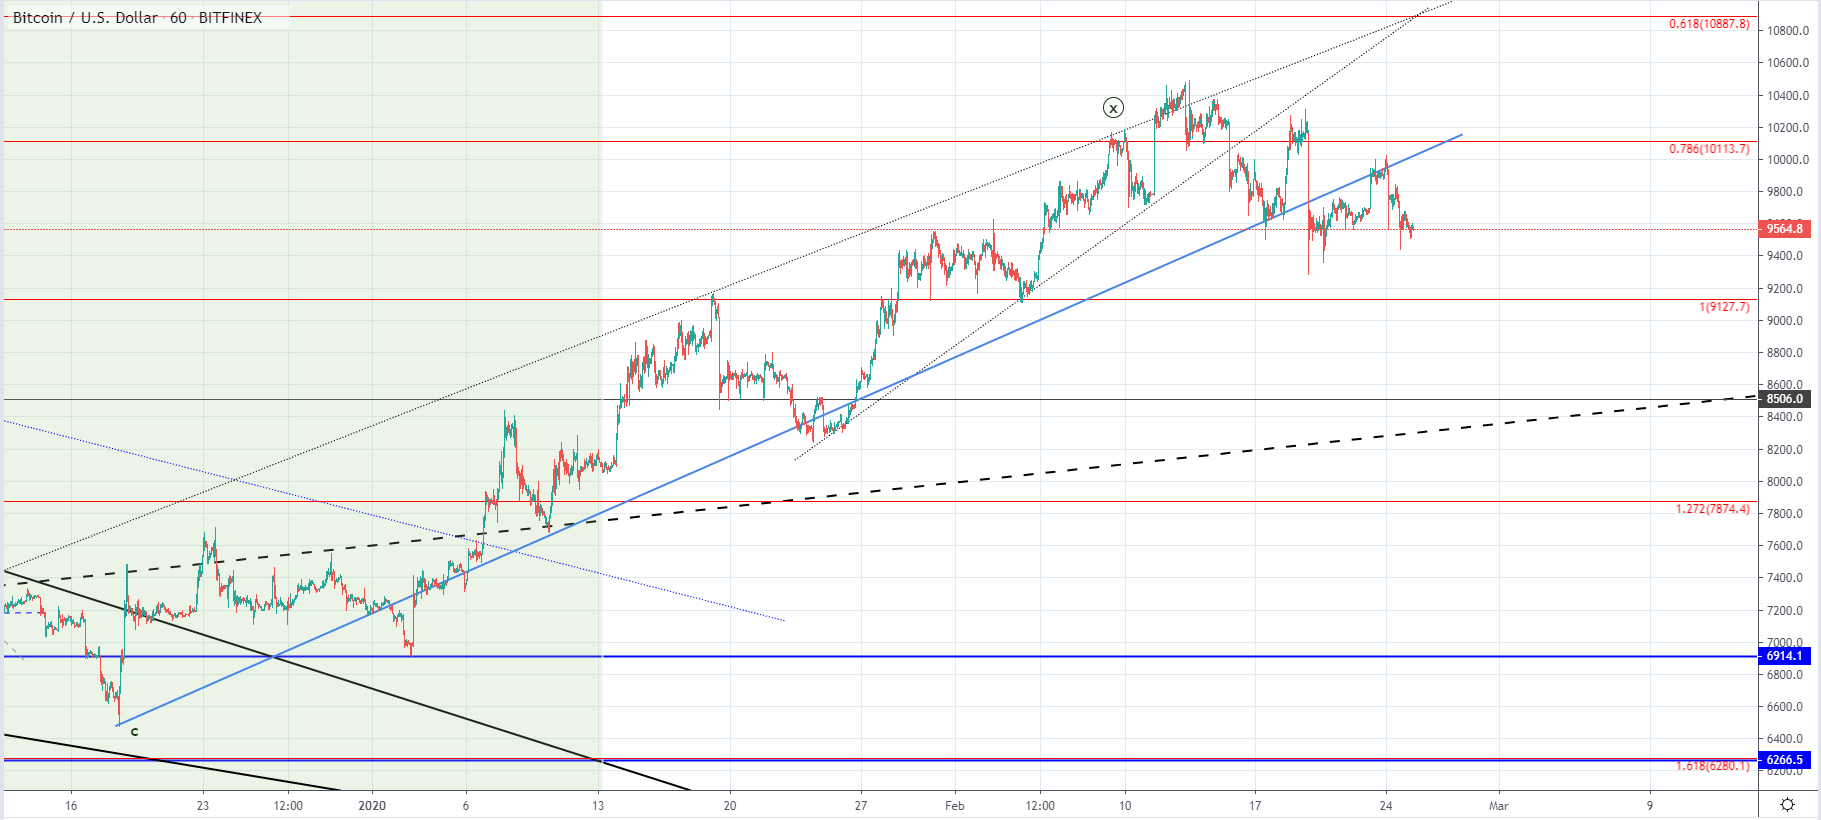 Looking at the hourly chart, we can see that the price has broken out from the ascending support level, significant uptrend support from the ascending channel in which the price has been since December last year. On the 18th of December, the price has been sitting at $6544 and from there to its highest point this year at $10490 made on the 13th of February made an increase of 60%.
As we are now seeing a breakout to the downside from this ascending range it could indicate that the price increase has ended and that we are seeing the development of the descending wave. The fact that the price retested the ascending support for resistance after a breakout has been made and got rejected there makes this possibility more probable. It is worth noting that the price made a higher low compared to the prior one which had a large wick but a series of lower highs with spikey price action is confirming a downtrend.
This is why a lower low would be immediately expected, most likely to the 1 Fib level or somewhere around its vicinity, but if the correction of the same degree as the ascending channel wave, the price is set to go significantly lower then $9127.7.
XRP/USD
On yesterday’s open the price of Ripple was $0.2839 and from there to it’s lowest point today so far which is at $0.2626 made a decrease of 7.51%. Like in the case of Bitcoin, Ripple’s price is also still hovering around those levels. but unlike Bitcoin, Ripple’s price chart made a lower low compared to the previous one at around $0.267.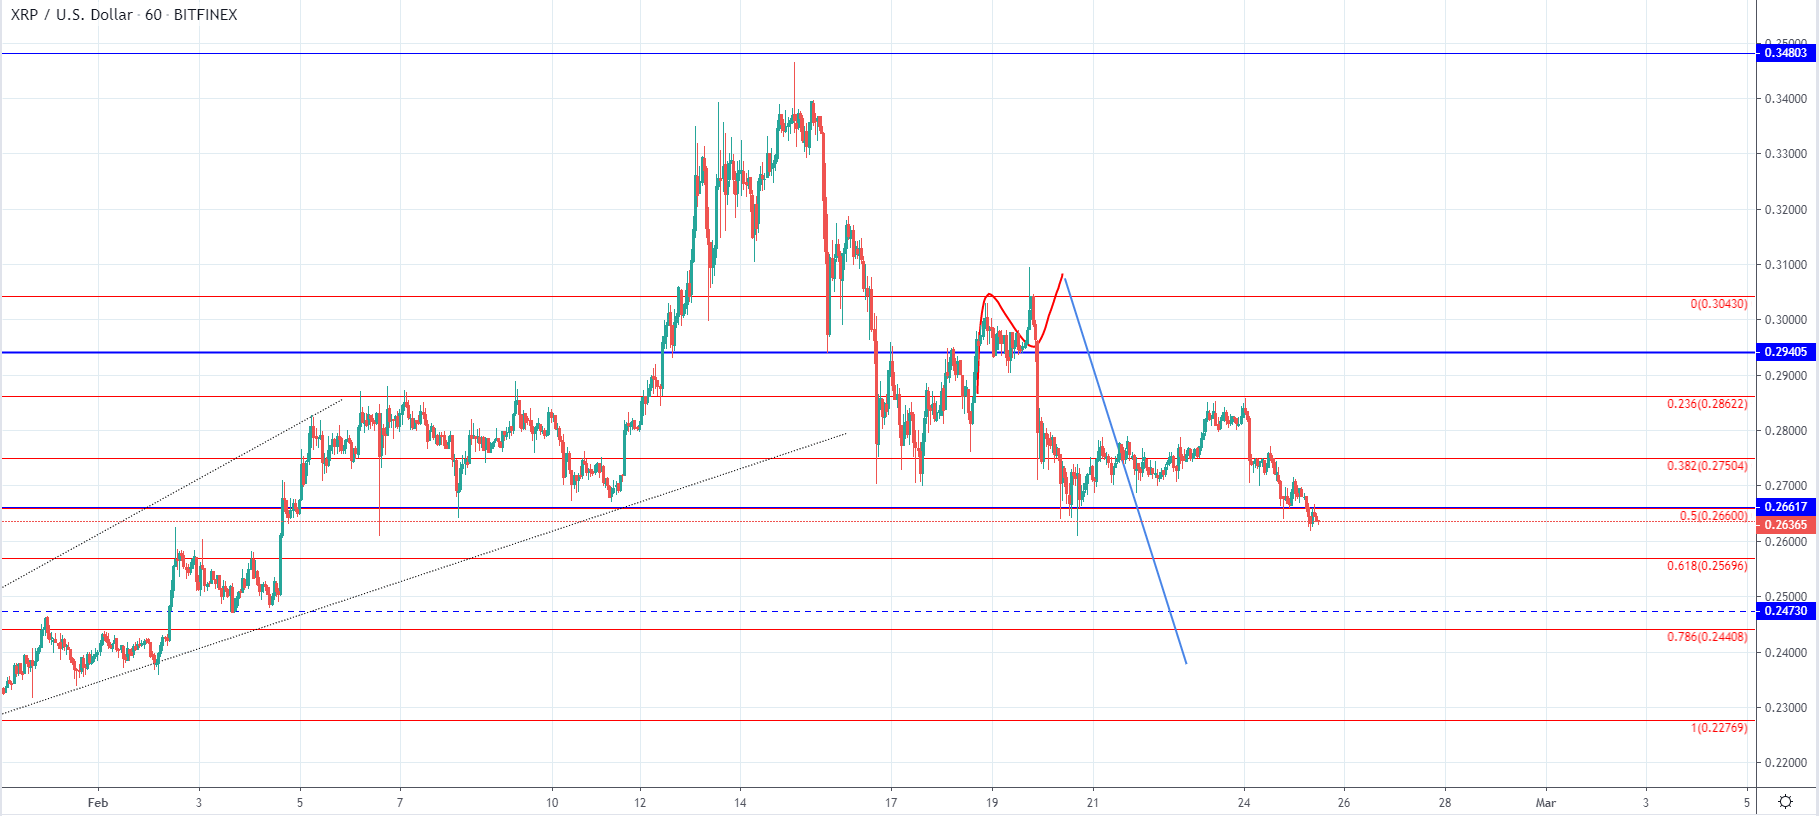 As you can see by looking at the hourly chart the price made inside the territory of the lower range below the significant horizontal level at $0.266 where the 0.5 Fibonacci level is. This could be an early indication that the price is going to continue moving to the downside potentially even below the 0.786 Fibonacci level which was outlined as a scenario in the previous analysis but the decrease could stop on some of the higher support levels like the 0.618 Fib or the $0.24730 horizontal.
If the price, however, spikes to the upside in the following day it could mean that this breach below the $0.266 level was a dip that retested the vicinity of the prior low’s spike looking to activate another round of buying that is needed for the price to catch up some upward momentum.
FXOpen offers the world's most popular cryptocurrency CFDs*, including Bitcoin and Ethereum. Floating spreads, 1:2 leverage — at your service. Open your trading account now or learn more about crypto CFD trading with FXOpen.
*At FXOpen UK and FXOpen AU, Cryptocurrency CFDs are only available for trading by those clients categorised as Professional clients under FCA Rules and Professional clients under ASIC Rules respectively. They are not available for trading by Retail clients.
This article represents the opinion of the Companies operating under the FXOpen brand only. It is not to be construed as an offer, solicitation, or recommendation with respect to products and services provided by the Companies operating under the FXOpen brand, nor is it to be considered financial advice.
Latest articles

AUD/USD Rises Sharply on Inflation News
The Consumer Price Index for Australia was released this morning. According to ForexFactory:
→ CPI in quarterly terms: actual = 1.0%, expected = 0.8%, previous value = 0.6%;
→ CPI in annual terms: actual = 3.5%, expected = 3.4%, previous value = 3.

TSLA Share Price Up About 13% Despite Disappointing Report
Yesterday, TSLA trading closed at USD 144.68 per share, after which Tesla reported its results for the 1st quarter:
→ earnings per share: actual = USD 0.45, forecast = USD 0.49;
→ gross income: actual = USD 21.45 billion, forecast = USD

Market Analysis: Gold Price Corrects Gains While Oil Price Regains Strength
Gold price rallied above $2,400 before correcting lower. Crude oil price is rising and it could climb further higher toward the $85.50 resistance.
Important Takeaways for Gold and Oil Prices Analysis Today
· Gold price rallied significantly above $2,