


FXOpen
BTC/USD
The price of Bitcoin has been on a decline since the 10th of May when it reached a high of $59,512. From there we have seen a decrease of 29.3% so far as it fell down to $42,180 at its lowest point. It is currently retesting those low levels for support and it appears to have stabilized as it made another attempt to continue its downward trajectory but bounced off of the low levels. Now it is moving slightly to the upside and is being traded at $44,923.
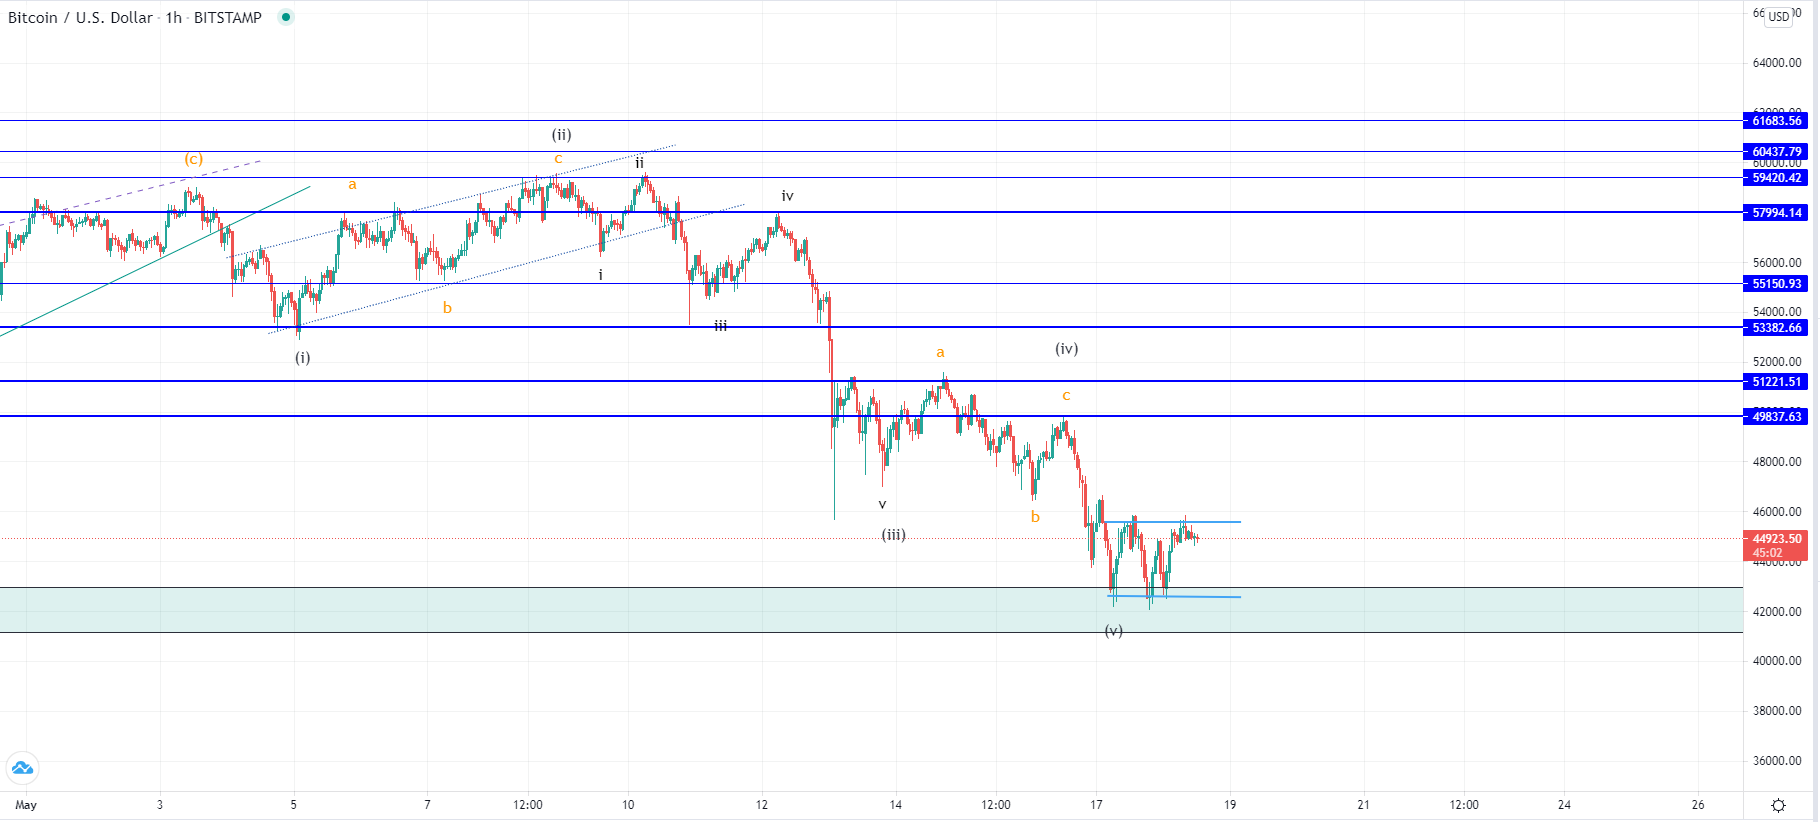
Looking at the hourly chart above, we can see that this down move from the 10th is the continuation of the decrease that started from the 14th of April after the price reached a new all-time high. As it is most likely the 3rd sub-wave of the corrective ABC this could mean that the descending move has ended on the current interaction with the significant horizontal support zone.
However, if this is the 4th wave of the cycle degree the correction might get deeper and prolonged. In this case, these first three waves could be prolonged by another two more either as the WXYXZ complex correction or in the worst-case scenario a five-wave impulse that would only be the 1st sub-wave of the higher degree ABC.
We are shortly going to see from the expected upward move and the following pullback which scenario could be more likely but for now the primary one is that the downfall could have ended as the ABC move.
XRP/USD
From yesterday’s low at $1.321 the price of Ripple has increased by 22% as it came up to $1.612 where its currently being traded and is still moving in an upward trajectory.
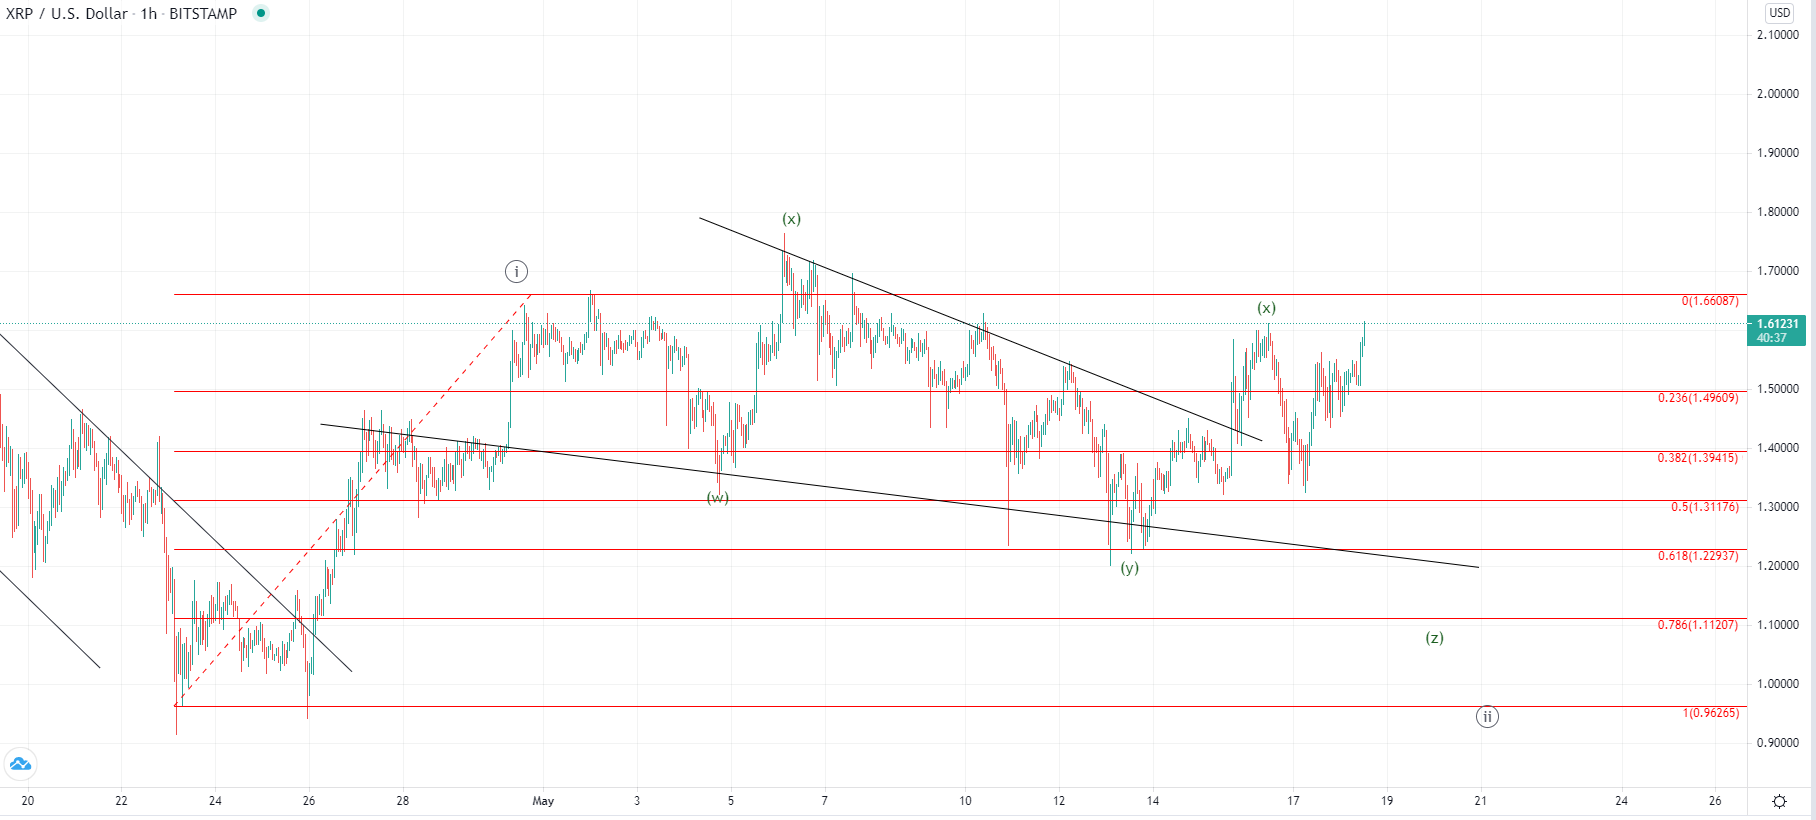
This is the continuation of the upward movement that started on the 14th when the price of Ripple $1.23 which was another retest of the descending support level from the triangle in which it was from the 6th. It is still uncertain whether or not this breakout was the start of the next impulsive move to the upside and the completion of the 2nd wave of the higher degree count or is another corrective increase before further downside.
We have seen interaction with the 0.618 Fib level on the 14th where the price found support and bounced strongly. This could be the sign that the previous descending move ended but the wave structure that followed ended as a three-wave decrease which looks more like another X wave from the complex correction count. Because of this the more likely scenario would be that the price is going to make a new lower low but we have to see a clear validation.
This forecast represents FXOpen Markets Limited opinion only, it should not be construed as an offer, invitation or recommendation in respect to FXOpen Markets Limited products and services or as financial advice. Cryptocurrency CFDs are not available to trade in all jurisdictions.
FXOpen offers the world's most popular cryptocurrency CFDs*, including Bitcoin and Ethereum. Floating spreads, 1:2 leverage — at your service. Open your trading account now or learn more about crypto CFD trading with FXOpen.
*At FXOpen UK and FXOpen AU, Cryptocurrency CFDs are only available for trading by those clients categorised as Professional clients under FCA Rules and Professional clients under ASIC Rules respectively. They are not available for trading by Retail clients.
This article represents the opinion of the Companies operating under the FXOpen brand only. It is not to be construed as an offer, solicitation, or recommendation with respect to products and services provided by the Companies operating under the FXOpen brand, nor is it to be considered financial advice.
Latest from Cryptocurrencies
Latest articles

Weekly Market Wrap With Gary Thomson: UK100, USD, GOLD, OIL
Get the latest scoop on the week's hottest headlines, all in one convenient video. Join Gary Thomson, the COO of FXOpen UK, as he breaks down the most significant news reports and shares his expert insights.
- UK100 Share Index Rises

What Is a Darvas Box Theory and How Does It Work in Trading?
The Darvas Box Theory, pioneered by Nicolas Darvas in the 1950s, has transcended its stock market origins to become a valuable tool for forex traders. This method leverages specific price movements and patterns, known as the Darvas Box, to track

NFLX Stock Price Falls Despite Subscriber Growth
Yesterday, after the close of the main trading session on the stock market, Netflix reported to investors for the 1st quarter of 2024.
The report turned out better than expected:
→ earnings per share: actual = USD 5.28, forecast = USD 4.