


FXOpen

BTC/USD
The price of Bitcoin has increased by 6.74% from yesterday’s low at $18054 as it came up to $19268 at its highest point today. We have seen the majority of the increase in the last couple of hours with the price currently sitting around today’s high and still in an upward trajectory.
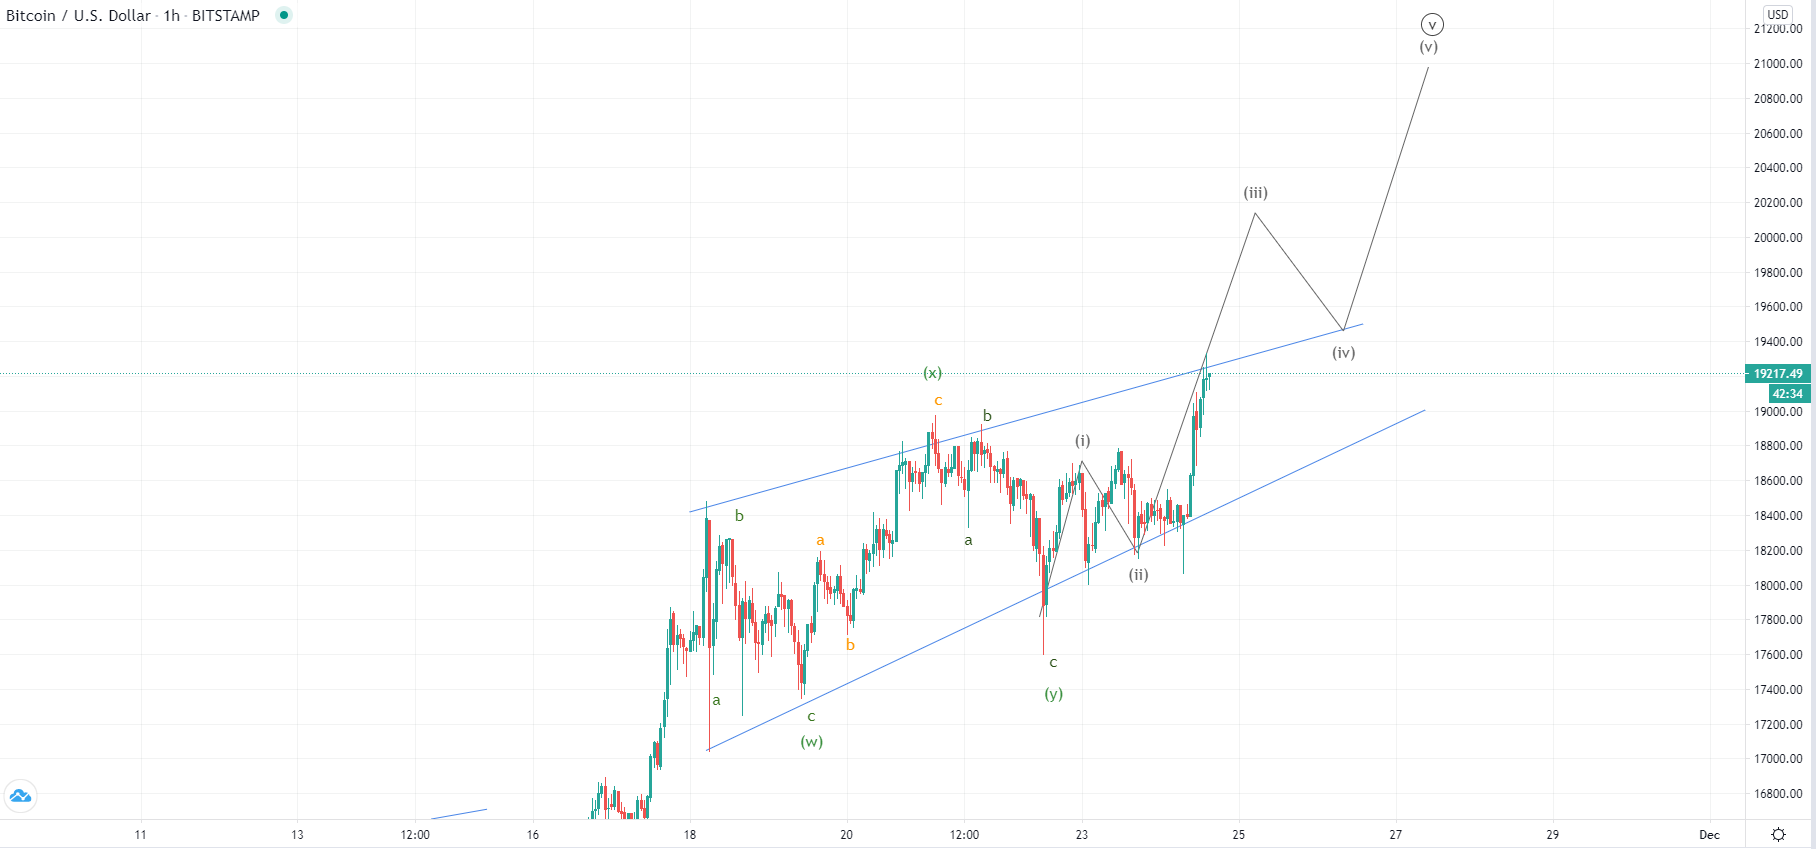
On the hourly chart, we can see that from the 18th of November another ascending channel has been forming in which the price has moved respectfully and is currently interacting with its resistance level. On yesterday’s low, interaction with its support level has been seen, and since the support has been found today another increase was made. The price is showing strong bullish momentum and is likely to break out from the ascending range on the current rise and continue moving to the upside from here.
Inside the ascending range, we have seen a three-wave movement which is indicative of a corrective movement which is why from the 18th until the 22nd I have labeled it as a WXY correction that was sub-divided in thee ABC corrections. This is why now since the correction ended according to this count another five-wave impulse is likely to develop and make a new all-time high before the completion of the 5th wave of the highest degree count.
Another possibility could be that we are seeing an ending diagonal in which case the increase was seen from the 19th until the 21st was its first wave and would lead the price back to the support level of the ascending triangle before another interaction with its resistance in a final move.
In either way, it would be expected that the price makes higher highs and most likely a new all-time high in the upcoming period.
XRP/USD
The price of Ripple has experienced an exponential increase from last week, coming from $0.264 last Monday to $0.783 yesterday which was an increase of 196% in just seven days. Since yesterday’s high a minor pullback to the $0.6 area but is now sitting at $0.6728 as a minor recovery was made.
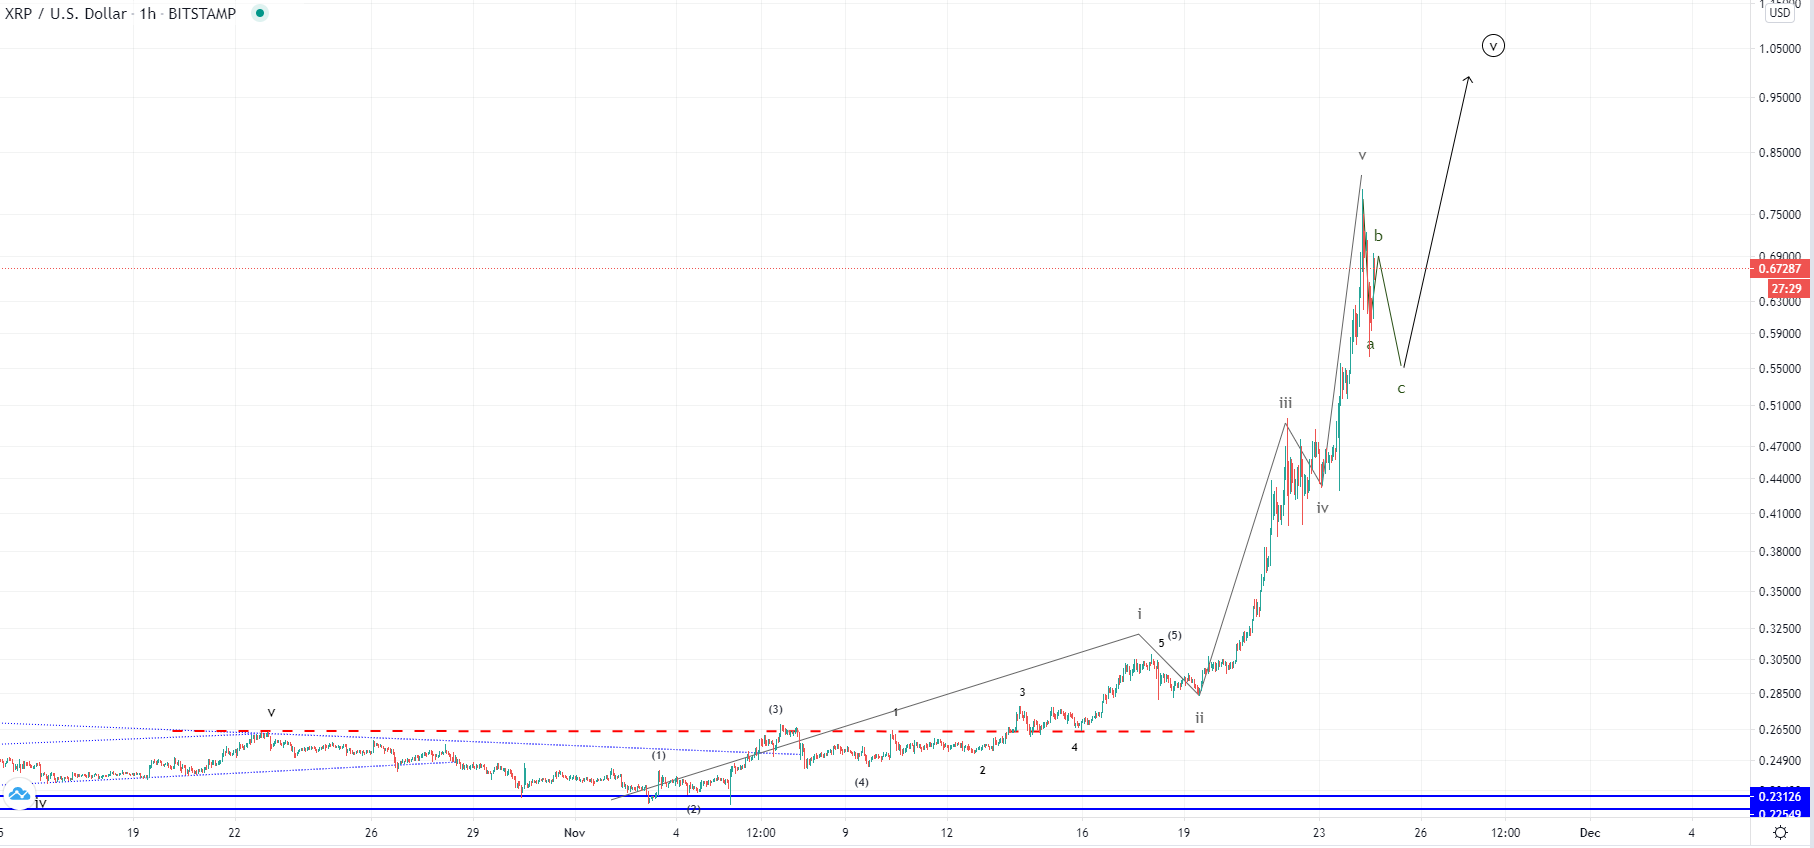
Looking at the hourly chart, we can see since a breakout was made above the horizontal resistance around $0.265 the price fell back for a retest of support which was the last Monday’s low. As it found support there it continued increasing again to $0.305 which was the end of the 1st wave out of the next five-wave impulse to the upside. This five-wave move was most likely the 3rd wave out of the higher degree count out of which the 1st one ended its 5th wave on the interrupted red line around the 22nd of October.
If this is true, then the current correction is its 4th wave and is set to push back the price for another establishment of support before the final wave is to complete. For now, the $0.55 area looks like it might be where the correction ends but we are yet to see how it develops. After the current pullback, further price growth would be expected to the vicinity of the $1 level which is a psychologically significant number.
FXOpen offers the world's most popular cryptocurrency CFDs*, including Bitcoin and Ethereum. Floating spreads, 1:2 leverage — at your service. Open your trading account now or learn more about crypto CFD trading with FXOpen.
*At FXOpen UK and FXOpen AU, Cryptocurrency CFDs are only available for trading by those clients categorised as Professional clients under FCA Rules and Professional clients under ASIC Rules respectively. They are not available for trading by Retail clients.
This article represents the opinion of the Companies operating under the FXOpen brand only. It is not to be construed as an offer, solicitation, or recommendation with respect to products and services provided by the Companies operating under the FXOpen brand, nor is it to be considered financial advice.
Latest from Cryptocurrencies
Latest articles

What Order Imbalance Is and How To Use It in a Trading Strategy
Understanding the nuances of order imbalances is key for traders looking to navigate the ebb and flow of asset prices. Order imbalances provide a clear window into the supply and demand dynamics at play, offering strategic insights. This article delves

XAU/USD Gold Price Reaches an Important Resistance Zone
The XAU/USD gold chart today indicates that the historical record price of the metal is above USD 2,400 per ounce.
In addition to fears of a new round of inflation due to rising commodity prices, geopolitical tensions are

What Is a Break of Structure and How Can You Trade It?
In the ever-evolving world of Smart Money Concept (SMC) trading, a nuanced understanding of market dynamics is indispensable. This article explores the concept of Break of Structure (BOS), how to identify it, and its implications for trading strategies, setting traders